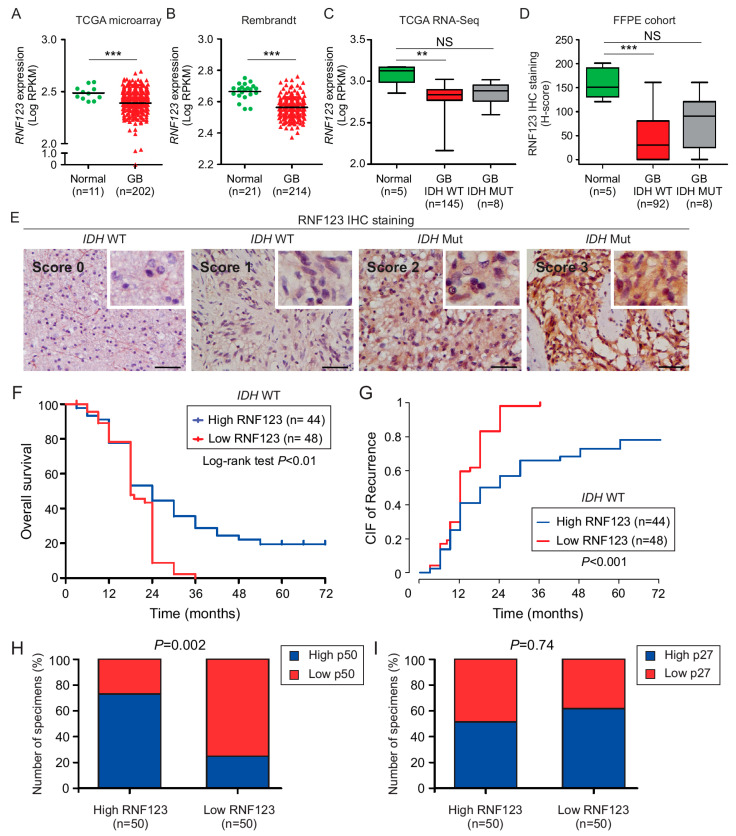
Figure 1.
Analysis of RNF123 protein and mRNA expression in GB tumors. (A,B). Dot plot of RNF123 mRNA expression in GB (n = 202; n = 214) tumors compared to normal brain tissue (n = 11; n = 21, respectively) using the microarray GB TCGA database (A) or GB Rembrandt dataset (B) (t-test *** p < 0.001). (C) Boxplot of RNF123 expression in IDH WT (n = 145) or mutated (n = 8) GB patients using RNA-sequencing TCGA dataset and compared to normal brain tissue (n = 5) (Kruskal–Wallis test, Dunn’s post hoc test ** p < 0.01, NS = non-significant). (D) Boxplot of RNF123 expression in FFPE samples from normal brain tissue (n = 5), and from IDH WT (n = 92) or mutated (n = 8) GB patients as determined by H-scores (Kruskal–Wallis test, Dunn’s post hoc test *** p < 0.001, NS = non-significant). (E) Representative IHC images for RNF123 staining in FFPE samples showing the scores (0, 1, 2, or 3). Scale bar = 50 μm (F) Kaplan–Meier curves to compare the percentage of survival in GB patients with low (n = 48) versus high (n = 44) RNF123 expression (log-rank test, p < 0.01). (G) CIF of recurrence in GB patients with low (n = 48) versus high (n = 44) RNF123 expression (p < 0.001). (H,I) FFPE samples derived from GB patients were classified as high or low RNF123 expression based on the median of H-scores and analyzed by IHC for p50 (H) or p27 (I). The percentages of patients with high or low expression of p50 (H) or p27 (I) are shown (Fisher’s exact test, p = 0.002 (H) and p = 0.74 (I)).

