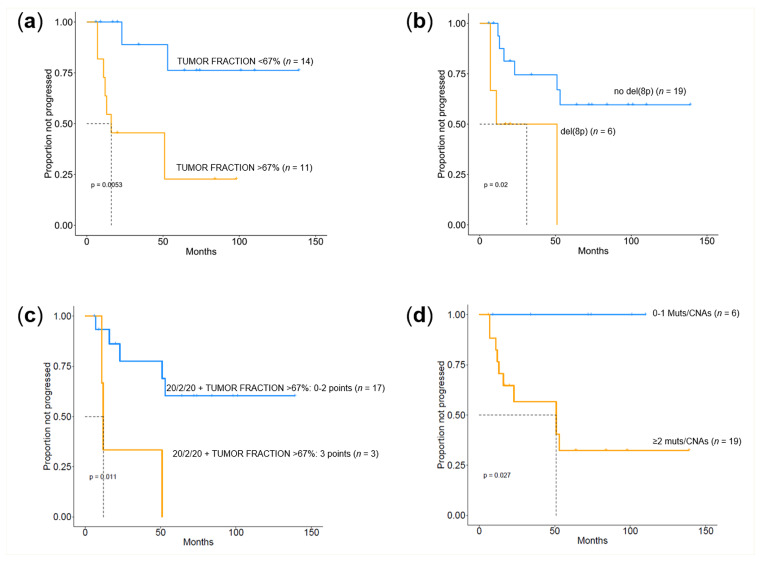
Figure 4.
Kaplan–Meier curves of time to progression (TTP) by next-generation sequencing (NGS)-derived molecular information in SMM. Kaplan–Meier curves of TTP according to the ichorCNA-estimated tumor fraction of bone marrow (BM) plasma cell (PC) genomic DNA (a), the occurrence of deletions in chromosome arm 8p (b), the 20/2/20 model integrated with the tumor fraction of BM PC genomic DNA (c), and the number of mutational and CNA events carried by each patient (d).

