Figure 2.
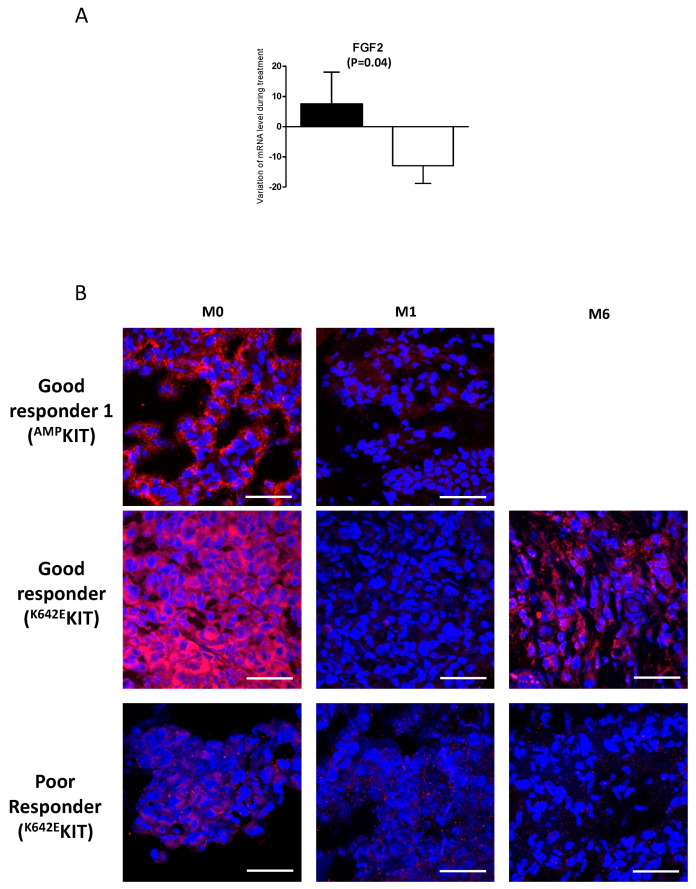
Variation of FGF2 expression during treatment. (A) Variation in expression between baseline and after 1 month of treatment with nilotinib of FGF2 mRNA expression, in patients treated with nilotinib with poor (black bar) or good (white bar) response following RECIST (respectively, n = 8 and n = 5). Box plot: middle bar, median; lower and upper box limits, 25th and 75th percentiles, respectively; whiskers, min and max values. Variables were compared with the Mann–Whitney test one tailed. (B) FGF2 expression in tumors assessed by immunofluorescence. Representative photographs of FGF2 stained in red in two good responders and a poor responder at baseline, and after 1 (M1) and 6 months (M6) of treatment. KIT alterations are indicated for each patient (AMPKIT = amplification of the KIT locus). DAPI stained cell nuclei (blue). Scale bar, 50 μm.

