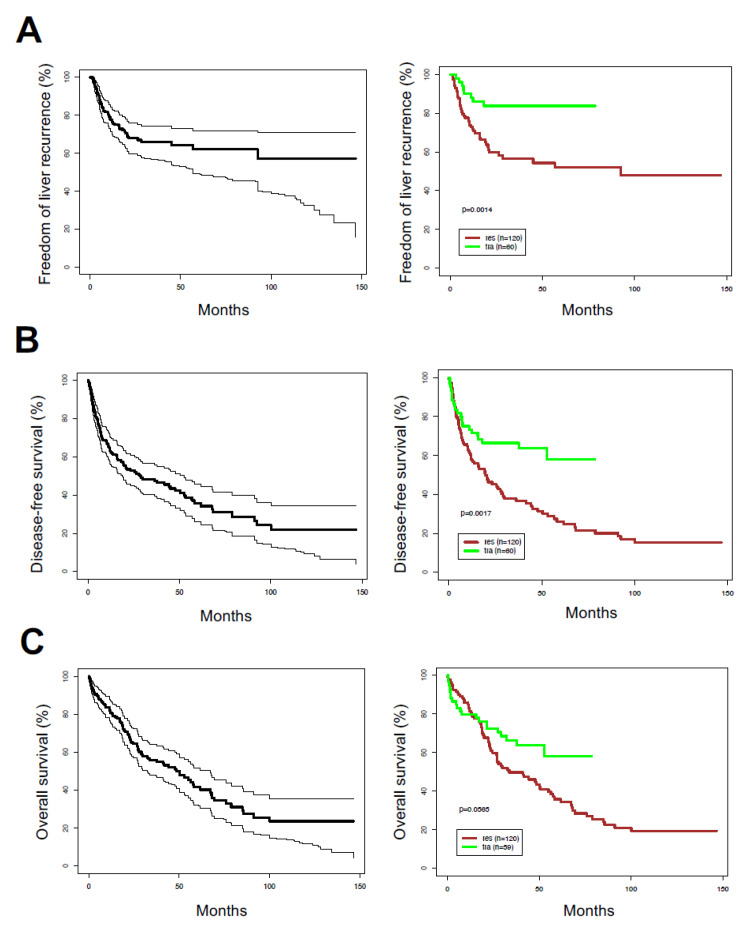
Figure 1.
Kaplan–Meier survival distributions in hepatocellular carcinoma patient cohort. (A) Freedom of liver recurrence; (B) disease-free survival; (C) overall survival. p-values are derived from the log-rank test. Left plots show data for all patients, right graphs show data after segregating by surgical treatment: liver resection (res) versus transplantation (tra).

