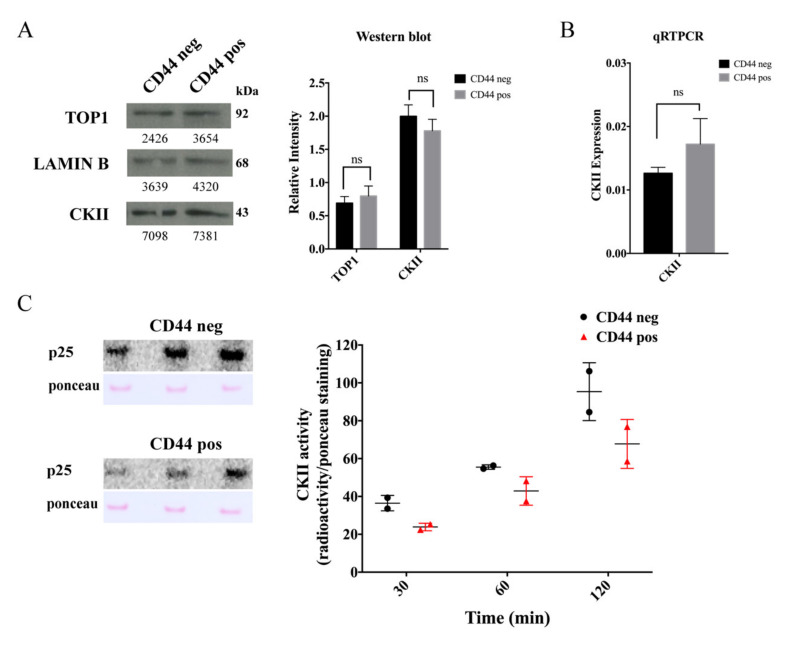
Figure 3.
Assessment of CKII in cancer stem-cell-like and non-cancer stem-cell-like Caco2 cells. (A) Left panel, Western blot analysis of nuclear extracts from non-CSC-like (CD44 negative, “CD44 neg”) or CSC-like (CD44 positive, “CD44 pos”) cells, developed using an anti-CKII antibody, anti-topoisomerase 1 (TOP1) antibody, or anti-LAMIN B antibody (as a loading control). Right panel, graphical depiction showing the results of densitometrical quantification of the bands shown in the Western blot. The intensity of the TOP1 and CKII specific bands were normalized relative to the intensity of the LAMIN B bands. Data were plotted as mean +/− standard error of the mean (SEM). The whole western blot figures are in Figure S10A. (B) Graphical depiction of the results for qRT-PCR analysis of CKII mRNA. CKII gene expression is calculated based on the Ct values using the following equations: ∆Ct = Ct(target) − Ct(reference) and ∆Ctexp = 2−∆Ct. Data were plotted as mean +/− standard error of the mean (SEM). ns: not significative difference (C) Left panels, CKII activity measured in nuclear extracts from non-CSC-like Caco2 cells (CD44 negative, “CD44 neg”) or CSC-like Caco2 cells (CD44 positive, “CD44 pos”). p25: representative autoradiogram of a membrane with p25 substrate (purified TOP1, amino acids (a.a.) 1–206), incubated with the nuclear extract from non-CSC-like Caco2 cells (CD44 negative) or Caco2 CSC-like cells (CD44 positive), γ-32P-ATP and inhibitors of non-CKII kinases for 30, 60, and 120 min. Ponceau: Ponceau stain of the same membranes. Right panel, graphical depiction of the ratio between the densitometric quantification of the radiolabeled bands (phosphorylated p25) and the intensity of the Ponceau-stained p25 for the indicated time intervals. The graph shows values of two independent experiments.

