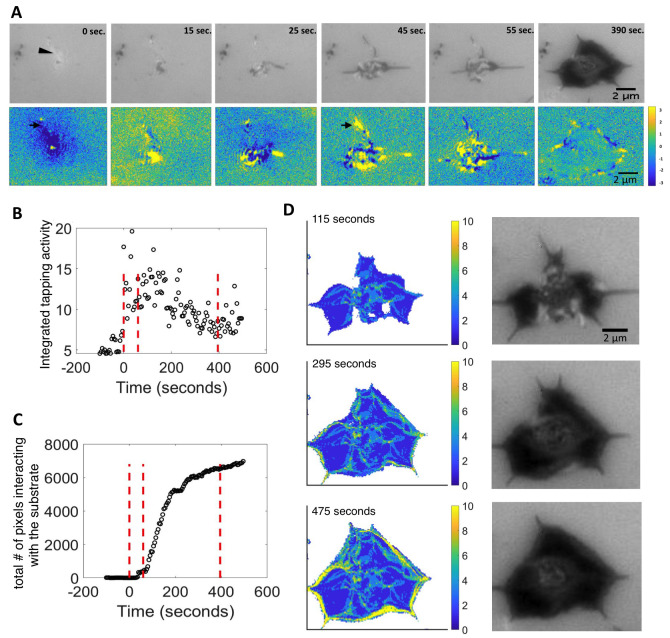
Figure 2. Quantification and image analysis of platelet spreading based on IRM live imaging for collagen IV.
( A) Platelet spreading viewed by IRM, and the corresponding focal activity map, ΔIRM t = IRM t – IRM t+1. Positive values (yellow) imply local attachment; negative values (blue) imply local detachment (bottom right). One filopodia initially attaching and detaching (black arrow). Scale bar 2 μm ( B) Integrated tapping activity of platelets: the mean absolute value |ΔIRM| at every time point. X-axis: Time in seconds. Y-axis: Platelet mean activity. Red dotted lines separate the phases: background, prior to platelet attachment, filopodial spreading phase, lamellipodial spreading phase, and the fully spread phase. ( C) Total number of pixels interacting with the surface over time. Time in seconds. ( D) Accumulated attachment and detachment events over time shown by activity map, yellow/blue means more/fewer events. Accumulated attachment and detachment events are adjacent to the color map. Images on the right correspond IRM images. Scale bar 2 um.

