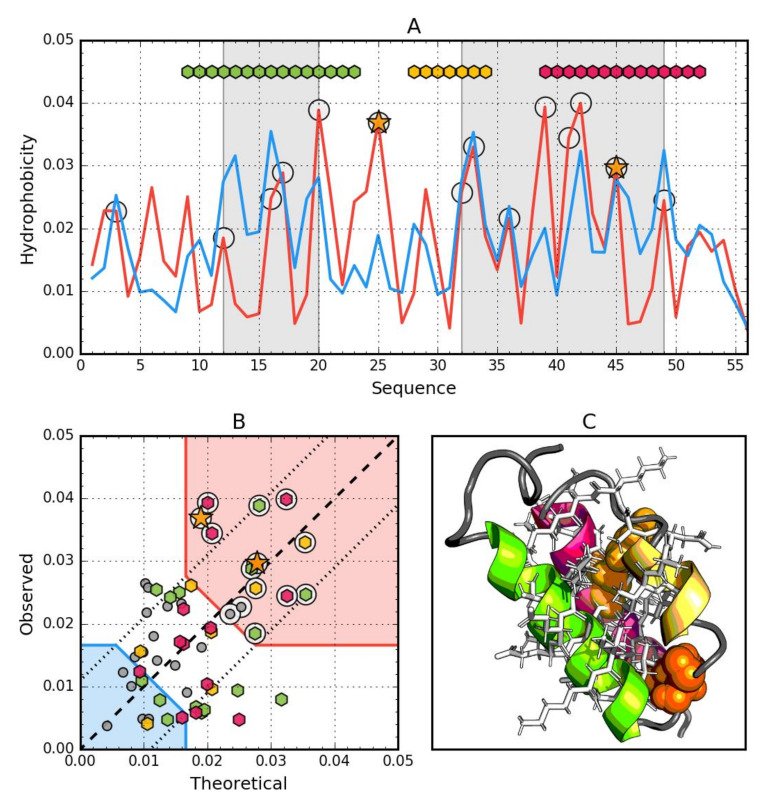
Figure 4.
Hydrophobic properties of Gb98-T25I (2LHG). (A) theoretical—blue and observed— red hydrophobicity density profiles. Markers at the top denote individually colored elements of the secondary structure: Hexagons—α-helices, squares—β-strands. White circles mark the location of hydrophobic core as determined by the FOD model. Gray-shaded regions encompass contiguous sequence fragments containing this core. Orange stars locate the mutations (T25I, L45Y). (B) theoretical and observed hydrophobicity density scatter plot. Red shade—hydrophobic core zone, blue shade—hydrophilic surface zone. Markers denote the same residues as markers on A, except for small dark gray circles which are hydrophobicity parameters of unstructured fragments. Dashed line—theoretical and observed value equality line. Dotted lines—theoretical and observed value similarity threshold. (C) 3D presentation of the molecule. Secondary structures are distinguished using the same colors as on A. Hydrophobic core fragments are shown as white sticks, while mutations as orange spheres.

