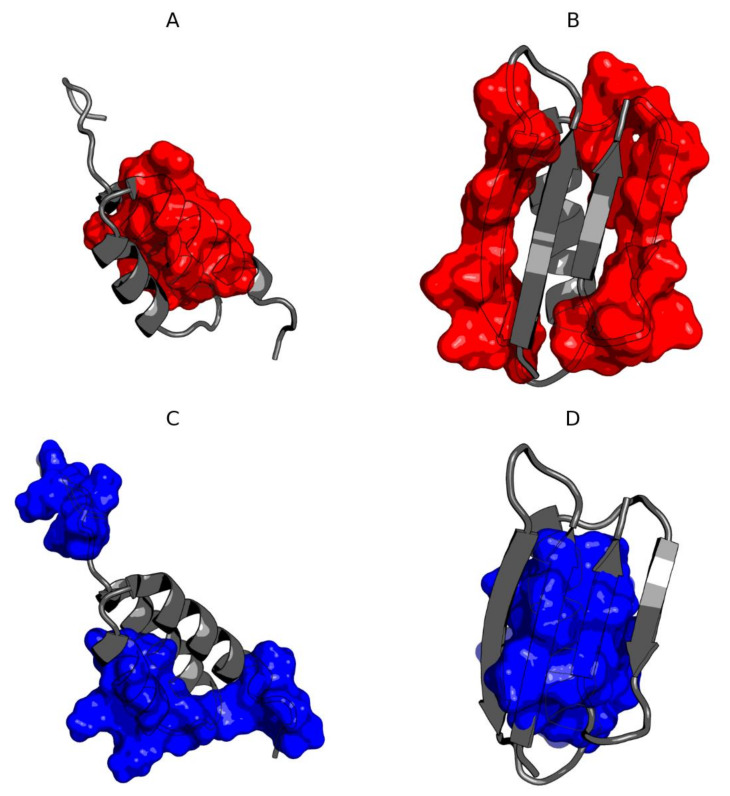
Figure 7.
3D presentation of Ga98 (A,C) and Gb98 (B,D) showing significant differences in the location of hydrophobic core. (A) Members of hydrophobic core of Gb98 (12–20, 39–49) in Ga98; (B) Members of hydrophobic core of Ga98 (12–20, 39–49) in Gb98; (C) Members of hydrophobic core of Ga98 (3–7, 24–34, 51–54) in Ga98; (D) Members of hydrophobic core of Gb98 (3–7, 24–34, 51–54) in Gb98.

