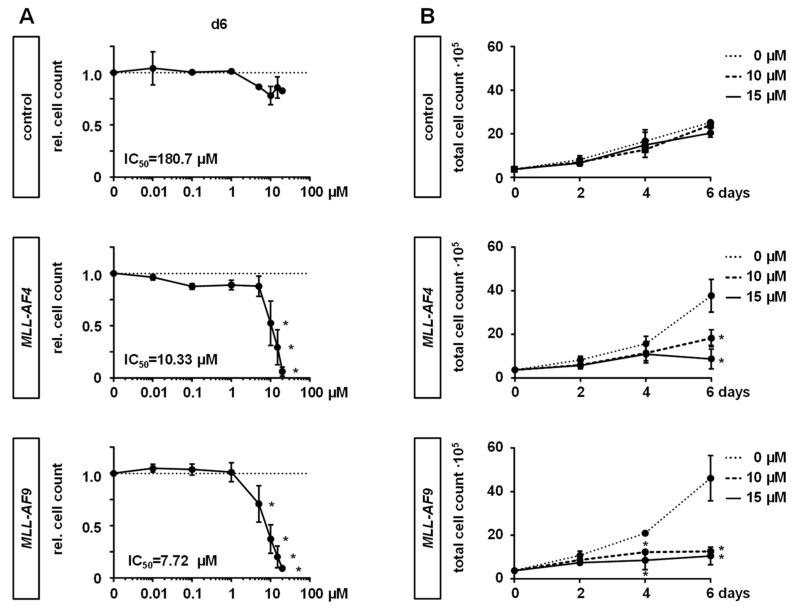
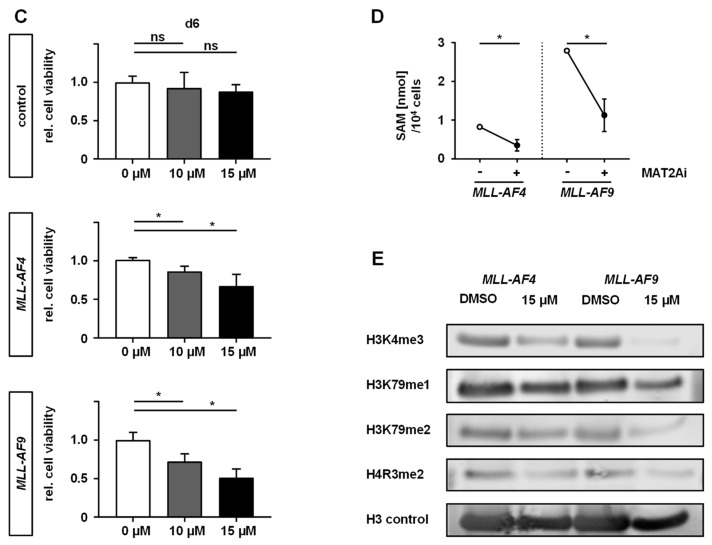
Figure 2.
MAT2A inhibition impairs the proliferation and viability of MLLr cells, resulting in reduced SAM levels and histone methylation. (A) MLL-AF4/-AF9 or culture-expanded CD34+ huCB control cells were treated with increasing concentrations of PF-9366 or vehicle (DMSO) for 6 days and the relative cell count was determined by flow cytometry using counting beads. Pooled data of three biological replicates (n = 3) performed in technical triplicates are shown. IC50 values of the dose–response curves were interpolated from a four-parameter logistic model constrained to 0 and 1 in GraphPad Prism. Dots represent the mean. Error bars indicate SD. One-way ANOVA was used with Dunnett correction: *, p < 0.05. (B) Proliferation curves were assessed by treating the indicated cells with PF-9366 (10, 15 µM) or control (DMSO) and counting cells following Trypan blue staining every second day. The mean of pooled data of three biological replicates (n = 3) performed in technical triplicates is shown. Dots represent the mean. Error bars indicate SD. One-way ANOVA was used with Dunnett correction: *, p < 0.05. (C) Cell viability of MLLr and control cells upon inhibition treatment with PF-9366 (10, 15 µM) or control (DMSO) was determined after 6 days by fluorescence-based read of alamarBlue assay. Experiment was performed in three biological replicates (n = 3) and technical triplicates. Bars represent the mean. Error bars indicate SD. One-way ANOVA was used with Dunnett correction: *, p < 0.05. (D) MLLr cells were treated with 15 µM PF-9366 or DMSO as a control for 6 days. Intracellular SAM levels of 104 cells were quantified by fluorescence-based Bridge-It Assay Platform Technology using a SAM standard curve. Results of two independent experiments (n = 2) are displayed. Student’s t-test was used: *, p < 0.05. (E) Western blot analyses of extracted histones from MLLr cells treated with 15 µM or DMSO as the control for 6 days are displayed showing decreased global methylation of H3K4me3, H3K79me1, H3K79me2, and H4R3me2. Blots are cropped and full images are displayed in Figure S4.


