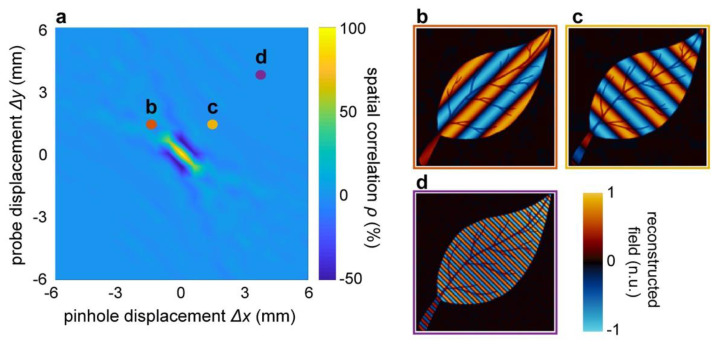
Figure 4.
Influence of the pinhole displacement on the Fourier detection of TIMING reconstruction coefficients. (a) Spatial correlation between the reconstructed and original image as a function of the sampling function position in the focal plane. The displacement (Δx, Δy) was measured with respect to the lens axis and the sampling function diameter was set to d = 0.36 mm, corresponding to a spatial correlation of 100% at the centre of the Fourier plane (cf. Figure 3e). (b–d) Examples of image reconstruction with off-axis detection, illustrating the appearance of spurious spatial frequencies. Interestingly, the object morphology was still noticeable, even at a relatively large distance from the optical axis.

