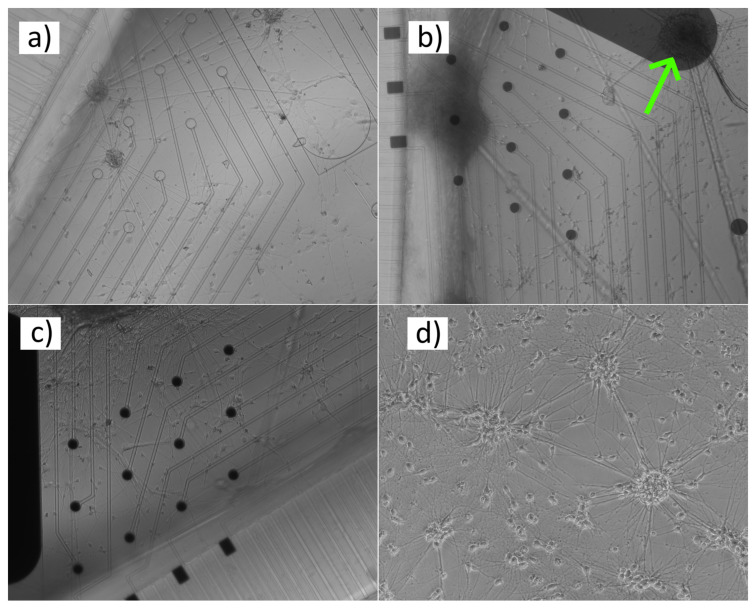
Figure 4.
Inverted microscope images of neuronal cell networks growing on different versions of batch 1 MEAs (a–c) and a control culture (d) grown at the same time on standard plastic plate (29 days after plating). (a) The cells are fully visible through the tracks and circular electrodes of MEA version 1. (b) In MEA version 2 the visibility through the electrodes drops to partial. However, the cells above the electrodes can still be seen (see especially the larger cluster on the grounding electrode, pointed out by the arrow). (c) No visibility through the electrodes in MEA version 3. The control image was taken with a different microscope than the MEA images.

