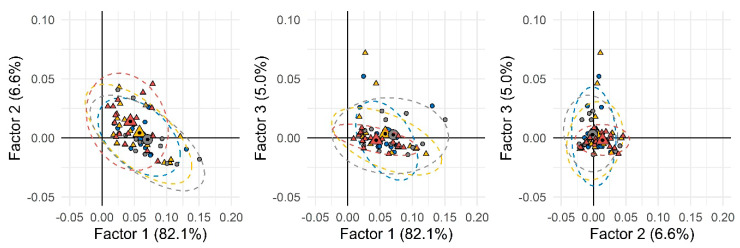
Figure 1.
Principal component analysis (PCA) scores-plot based on all detected peak-region features over the entire sample set. Group 1 (less sedentary group) and Group 2 (more sedentary group) were depicted as circles and triangles, respectively. Different colors were used to indicate males (blue and yellow) and females (gray and dark red). Small and large (with a black spot) symbols represent individual and mean values, respectively.

