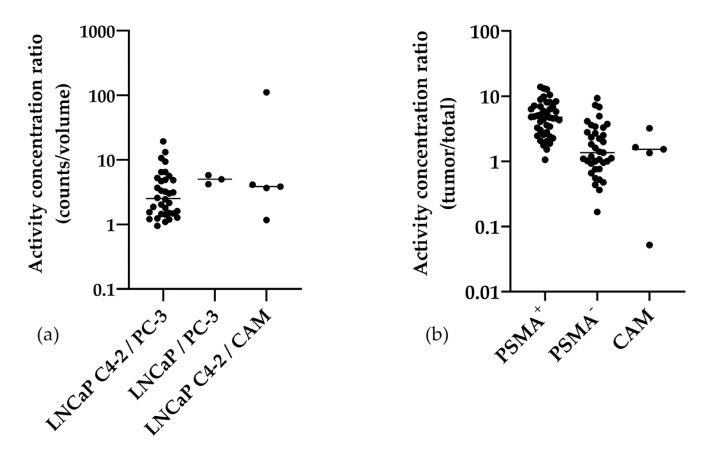
Figure 4.
Scatter plots of the activity concentration ratios of the three experimental groups (PSMA+/PSMA−) in logarithmic scale (a) and the activity concentration ratios of the tumor area and the total chick embryo (b). Each experiment is depicted as a single dot, the median is shown. Notably, all ratios but one had a value greater than 1 for the direct comparison of the tumor entities (a). All values of PSMA+ in comparison to the total chick embryo were >1 (b).

