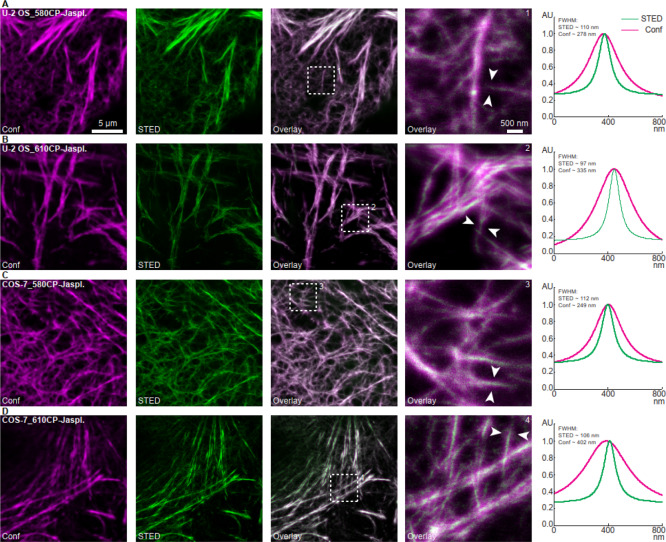
Figure 2.
In vitro labeling of actin filaments in U-2 OS and COS-7 cells with 580CP-jasplakinolide and 610CP-jasplakinolide probes (see Scheme 4 and ref (5)). (A,B) Human osteosarcoma (U-2 OS) cells and (C,D) kidney cells derived from the African green monkey (COS-7) were incubated with (A,C) 580CP-jasplakinolide (5 μM for 30 min) or (B,D) 610CP-jasplakinolide (1 μM for 60 min) probes, respectively (followed by a washing step of additional 30 min). Live-cell STED images were acquired using a quad scanning STED microscope (Abberior Instruments, Göttingen, Germany) equipped with a UPlanSApo 100×/1, 40 Oil objective (Olympus, Tokyo, Japan). (1–4) Line profiles (with a line width of 60 nm (three pixels) for averaging) were taken at locations indicated by arrows in the enlarged sections (right). The averaged data were fitted with a Lorentzian function and plotted. Except for contrast stretching, no further image processing was applied. Scale bars: 5 μm (overviews), 500 nm (enlarged sections). Abbreviations: AU (arbitrary units), Conf (confocal), FWHM (full width at half maximum), STED (stimulated emission depletion).

