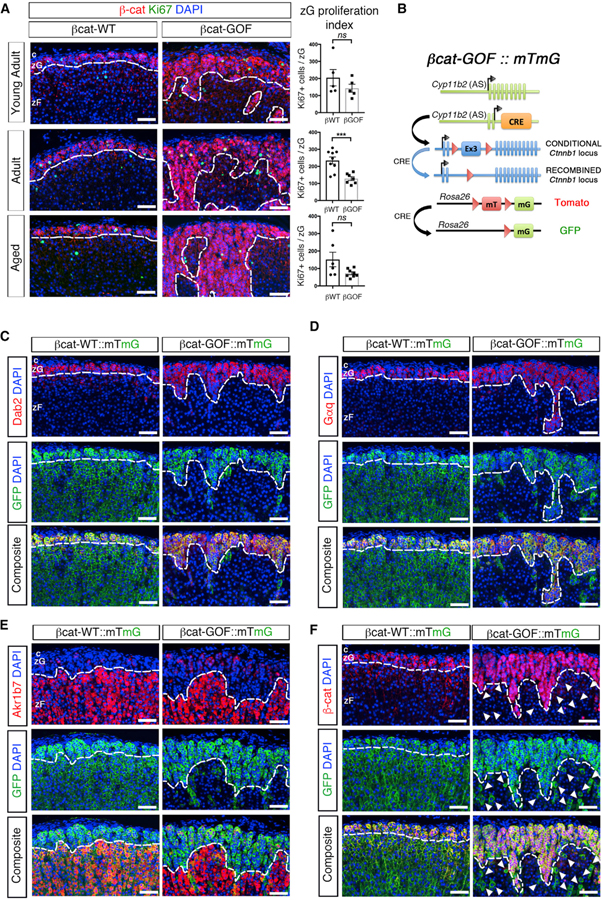
Figure 2. Stabilization of β-Catenin in zG Cells Blocks zG-to-zF cell Transdifferentiation.
(A) Left: representative adrenal sections co-stained for β-catenin (β-cat, red) and Ki67 (green). Right: quantification of the Ki67-positive cells normalized for the β-catenin-positive zG domain (zG proliferation index) (from left to right, top to bottom, n = 5, 5, 9, 7, 6, 8 mice).
(B) Schematic representation of the alleles comprising βcat-GOF::mTmG mice. βcat-WT::mTmG control mice have two copies of the wild-type Ctnnb1 allele.
(C) Representative adrenal sections co-stained for Dab2 (red) and GFP (green) (n = 9 mice for each genotype).
(D) Representative adrenal sections co-stained for Gαq (red) and GFP (green) (n = 9 mice for each genotype).
(E) Representative adrenal sections co-stained Akr1b7 (red) and GFP (green) (n = 3 mice for each genotype).
(F) Representative adrenal sections co-stained for β-catenin (β-cat, red) and GFP (green) (n = 5 mice for each genotype). All sections were counterstained with nuclear DAPI (blue) and were from adult mice. Arrowheads point at GFP-positive and β-catenin-negative zF cells. All dotted lines define the border between positive and negative regions for β-catenin, Dab2, Gαq, or Akr1b7, as indicated.
c, capsule. zG, zona Glomerulosa. zF, zona Fasciculata. Scale bars: 50 μm. ns, not significant; ***p < 0.001. Data are represented as mean ± SEM.
See also Figure S2.

