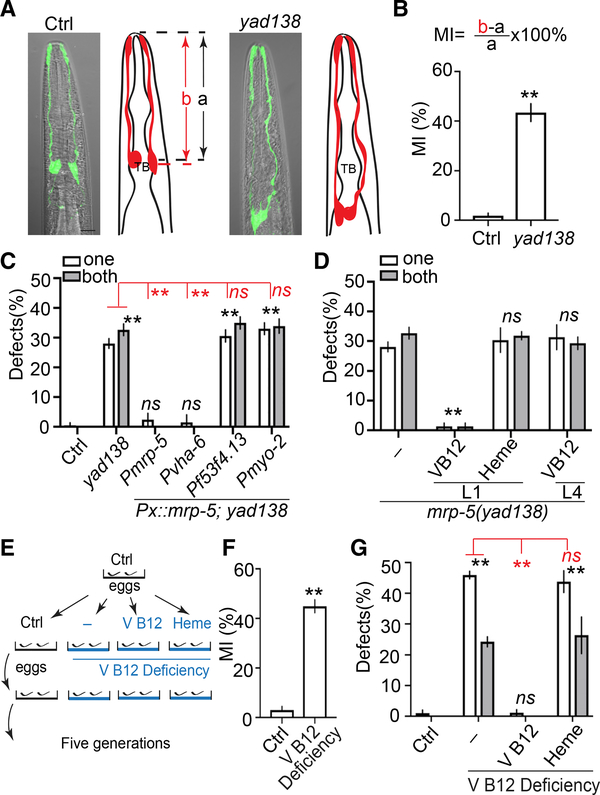
Figure 1. Vitamin B12 Is Required for Terminating Glial Migration.
(A) yad138 causes over-migration of AMsh glia. Confocal images and schematic representation of AMsh glia in control and mrp-5(yad138) animals expressing Pf53f4.13::GFP (yadIs48) are shown. TB, pharyngeal terminal bulb. Scale bar, 10 μm.
(B) Quantification of Migration Index (MI) in control and mrp-5(yad138) animals. MI is calculated as (b − a)/a × 100%. As illustrated in (A), “a” represents the distance between the tip of nose and the center of the pharyngeal terminal bulb. “b” shows the distance between the tip of nose and the center of the AMsh cell bodies.
(C) mrp-5 functions in the intestine to regulate Amsh migration. White and gray bars show the percentage of animals with over-migration defects in one AMsh or both AMsh glia, respectively. Pvha-6 is an intestine-specific promoter, Pf53f4.13 drives expression only in AMsh glia, and Pmyo-2 is a pharyngeal-muscle-specific promoter.
(D) Injection of vitamin B12, but not heme, rescues mrp-5(lf) phenotypes.
(E) A schematic showing how vitamin B12 deficiency was induced.
(F) Quantification of MI of AMsh glia in animals cultured in control and vitamin-B12-deficient conditions.
(G) Dietary supplementation of vitamin B12, but not heme, rescued AMsh migration defects in vitamin-B12-deficient conditions. Data show the percentage of animals with AMsh migration defects.
In (B) and (F), data are represented as mean ± SEM. One-way ANOVA test; **p < 0.01; each point represents at least 30 worms. In (C), (D), and (G), data are represented as mean ± SEM. Two-way ANOVA test; **p < 0.01; ns, no significant difference. Each point represents three experiments of at least 50 worms each.

