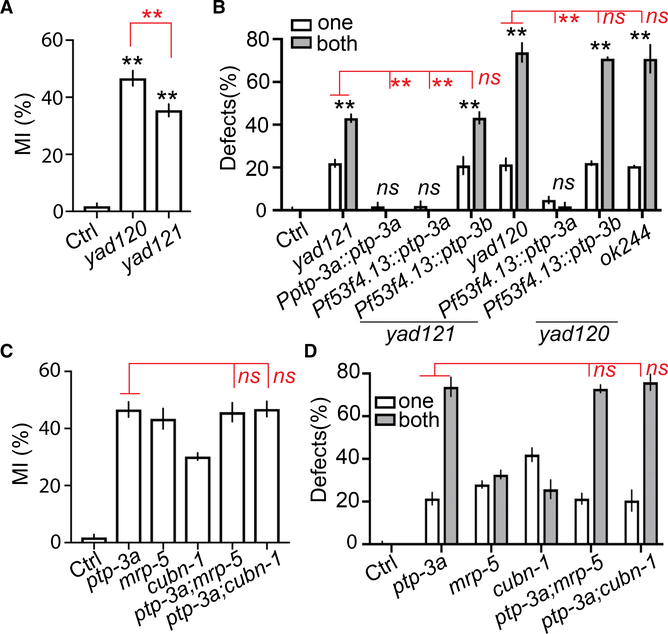
Figure 2. ptp-3a Functions in the Same Genetic Pathway as mrp-5 and Vitamin B12 in Regulating Glial Migration.
(A) Quantification of MI in control, ptp-3a(yad120), and ptp-3a,b(yad121) animals.
(B) ptp-3a, but not ptp-3b, regulates AMsh migration. White and gray bars show the percentage of animals with over-migration defects in one AMsh or both AMsh glia, respectively. Pf53f4.13 drives expression only in AMsh glia.
(C and D) Double mutants of ptp-3a;mrp-5 and ptp-3a;cubn-1 display similar defects as in ptp-3a single mutants. Quantification of MI of AMsh glia
(C) and the percentage of animals with over-migration defects (D) are shown.
In (A) and (C), data are represented as mean ± SEM. One-way ANOVA test; **p < 0.01; each point represents at least 30 worms. In (B) and (D), data are represented as mean ± SEM. Two-way ANOVA test; **p < 0.01; each point represents three experiments of at least 50 worms each.

