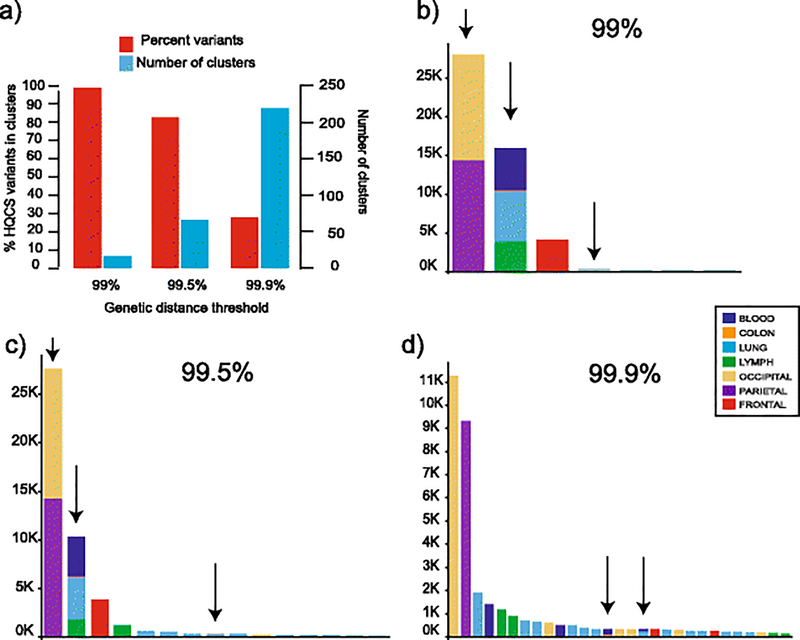
Fig. 2. Distance-based clustering for SMRT HQCS at 3 genetic distance thresholds.
(a) Percent of all variants placed in any cluster (red bars, left axis) and the total number of clusters (blue bars, right axis) at three thresholds (x-axis). (b-d) The number of total Aligned reads (y-axis) in identified clusters (x-axis) at three thresholds. The tissue of origin is represented by colors as shown in the legend. Arrows above the bars indicate clusters with sequences from >1 tissue. For clarity only clusters with >=100 reads are shown

