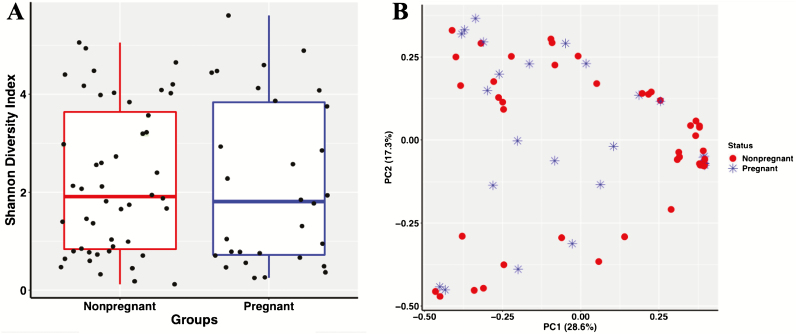
Figure 4.
Alpha diversity boxplot of the vaginal bacterial microbiota in Brangus heifers measured by the Shannon diversity index (panel A). The red box represents nonpregnant heifers and the blue box represents pregnant heifers. Black dots represent values for individual samples. Alpha diversity did not differ (P = 0.366) between pregnant vs. nonpregnant heifers. PCoA depicting Bray–Curtis dissimilarities across samples (panel B). Nonpregnant heifers are represented by red circles and pregnant heifers are represented by blue stars. There were no differences in beta diversity between pregnancy status (P = 0.74). PC, principal coordinate.

