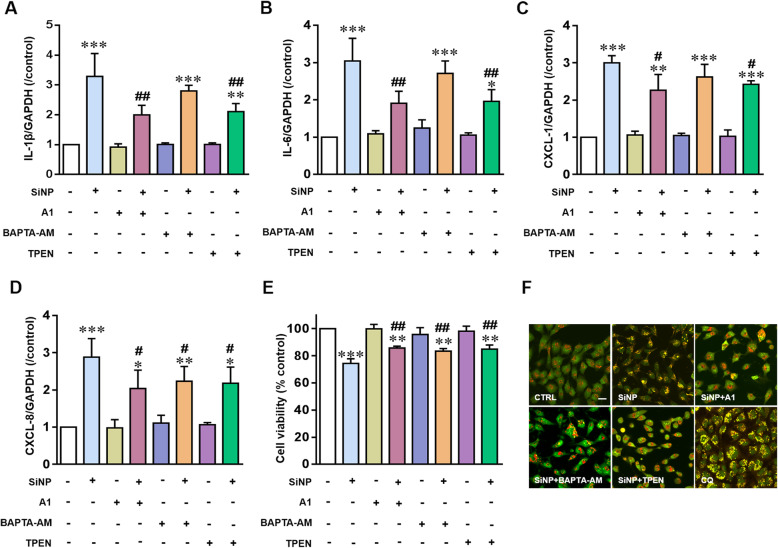
Fig. 8.
TRPM2-mediated lysosomal and autophagic dysfunction in SiNPs-induced inflammation in BEAS-2B cells. a-d Quantitative RT-PCR analysis of the mRNA expression levels for IL-1β (a), IL-6 (b), CXCL-1 (c) and CXCL-8 (d) in cells under control condition or after treatment with SiNPs (100 μg/mL) for 24 h with or without prior treatment with compound A1 (10 μM), TPEN (5 μM) or BAPTA-AM (1 μM). e Mean cell viability in cells under control condition or after exposure to SiNPs (100 μg/mL) for 24 h with prior treatment with compound A1 (10 μM), TPEN (5 μM) or BAPTA-AM (1 μM), from three independent experiments. f Representative confocal microscopic images showing acridine orange (AO) staining in cells under control condition or after exposure to SiNPs (100 μg/mL) for 24 h with or without prior treatment with compound A1 (10 μM), TPEN (5 μM) or BAPTA-AM (1 μM). Cells were incubated with CQ (50 μM) for 3 h as positive control. Scale bar = 20 μm. Data are from *P < 0.05, **P < 0.01, ***P < 0.001 compared to the control cells, and #P < 0.05, ##P < 0.01 compared to cells treated with SiNPs alone

