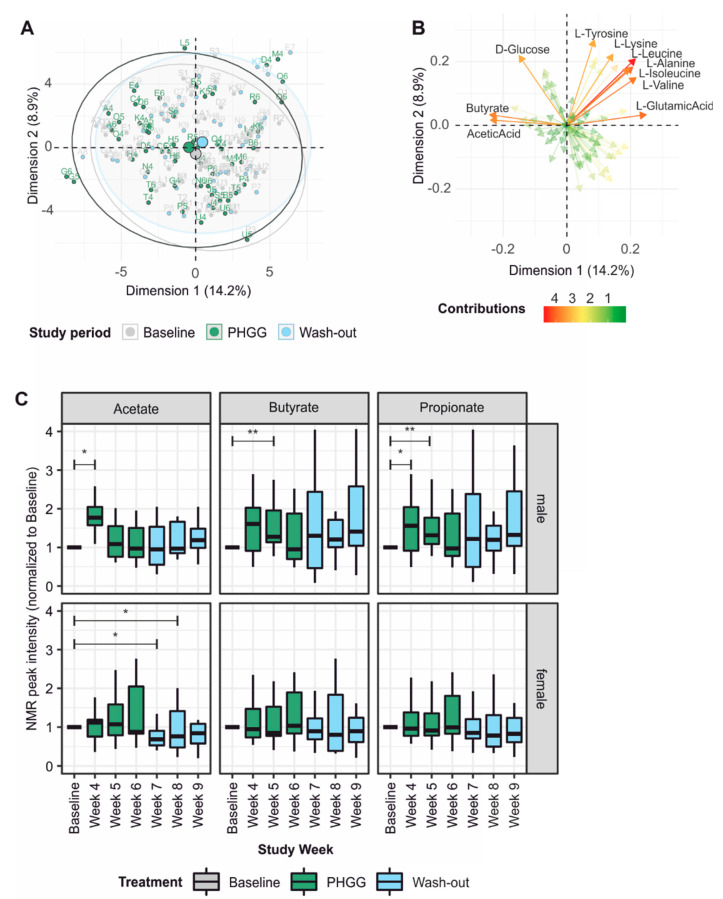
Figure 5.
NMR spectroscopy of fecal samples: Peaks were annotated automatically (A,B) or manually using reference spectra (C). (A) Principle component analysis of metabolite profiles by study period indicates a small shift during the PHGG intervention. (B) Butyrate and acetate contribute most to the changes seen in A. (C) Targeted analysis of SCFA levels in fecal samples reveals sex-dependent changes over time, with most significant effects at the beginning of the intervention period. Pairwise Wilcoxon tests with Bonferroni correction.

