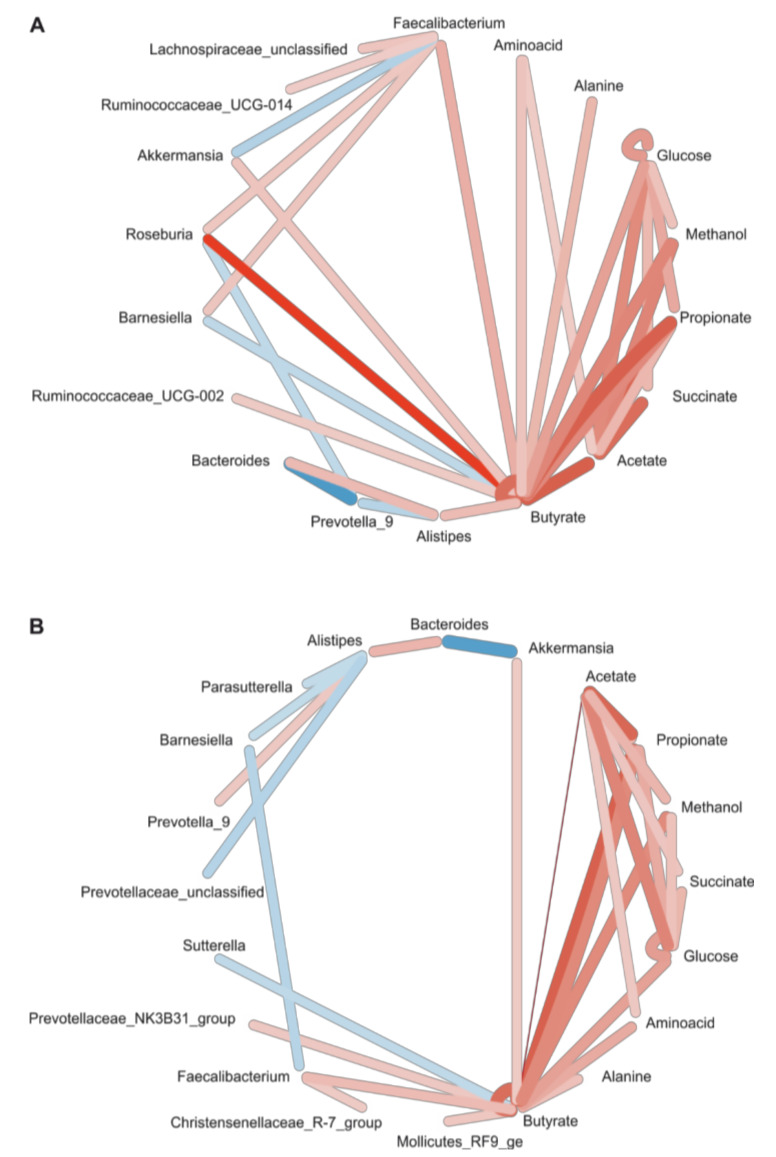
Figure 6.
Correlation network of taxa and metabolites. Correlations between taxon abundance and peak intensities were calculated using SparCC and taxonomic abundance data (A) for the V3–V4 and (B) the V1–V3 region. Both regions reveal an interaction network centered on butyrate, with strong links between the SCFA as well as to certain taxa. In both datasets, Faecalibacterium was positively correlated with butyrate. Edge color = direction of interaction: red = positive; blue = negative; Edge weight = strength of interaction, i.e., correlation coefficient; only interactions with a two-sided p-value of >0.05 were included.

