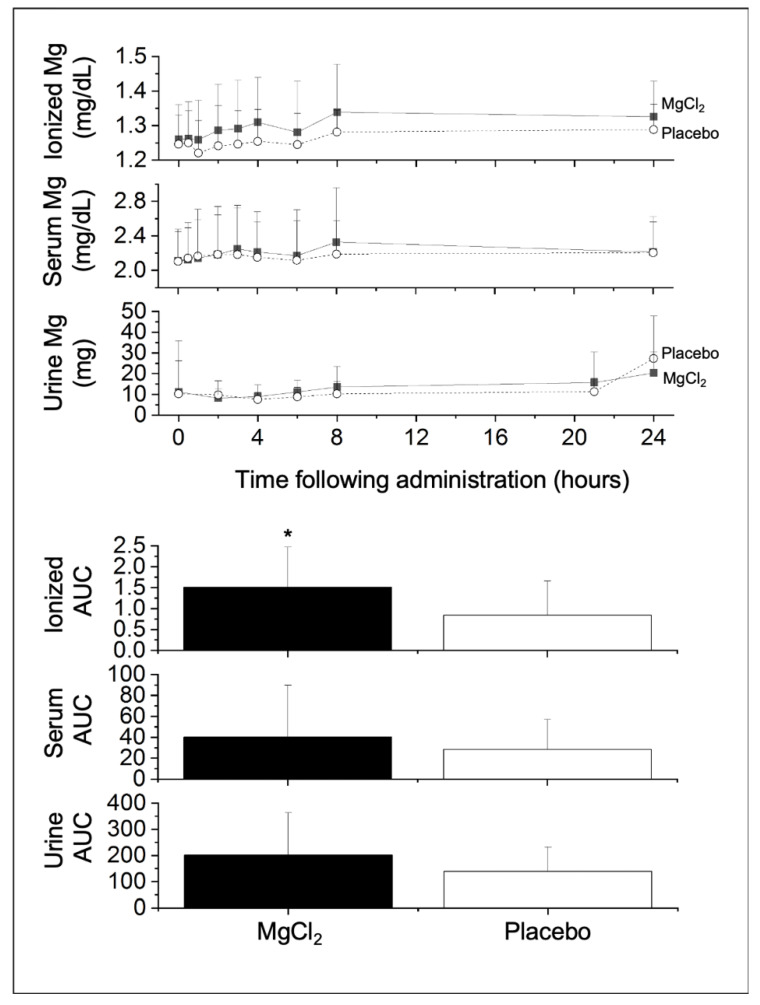
Figure 1.
Average whole blood concentration of ionized magnesium (iMg2+) and serum total magnesium concentrations, as well as urinary magnesium content (top); total area under the curve (AUC) in mg/dL•24h for iMg2+ and serum total Mg or mg•24h for urine Mg (bottom) over 24 h post-treatment for MgCl2 treatment vs. placebo. * Differences between MgCl2 versus placebo, p < 0.05. To convert between mg/dL and mmol/L, divide by 2.43.

