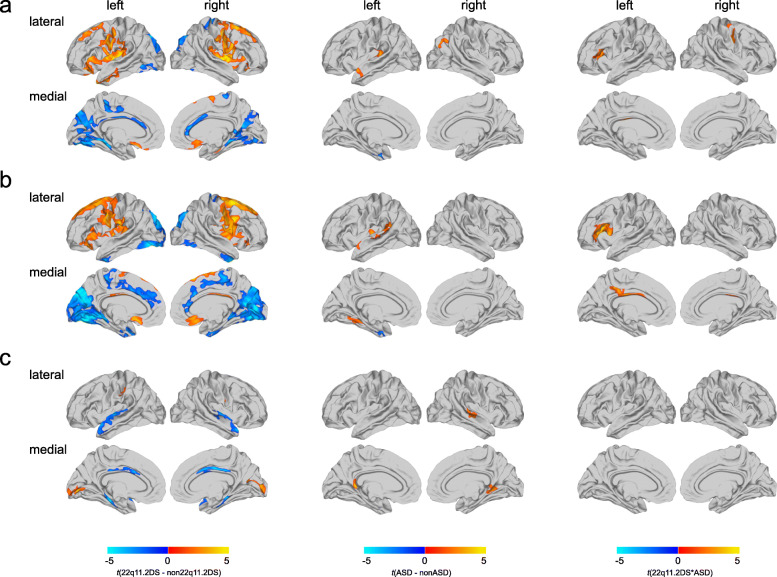
Fig. 1.
Categorical results for main effect of 22q11.2DS, main effect of ASD, and 22q11.2DS-by-ASD interaction effect.a Significant differences in cortical volume (CV), b surface area (SA), and c cortical thickness (CT) for the main effect of 22q11.2DS (left panel), the main effect of ASD (middle panel), and for the 22q11.2DS-by-ASD interaction (right panel). Displayed are the random field theory (RFT)-based cluster corrected (p < 0.05, 2-tailed) difference maps following multiple comparisons, where increased parameter estimates in 22q11.2DS (or ASD) are marked in red to yellow, and decreased parameters are marked in blue to cyan

