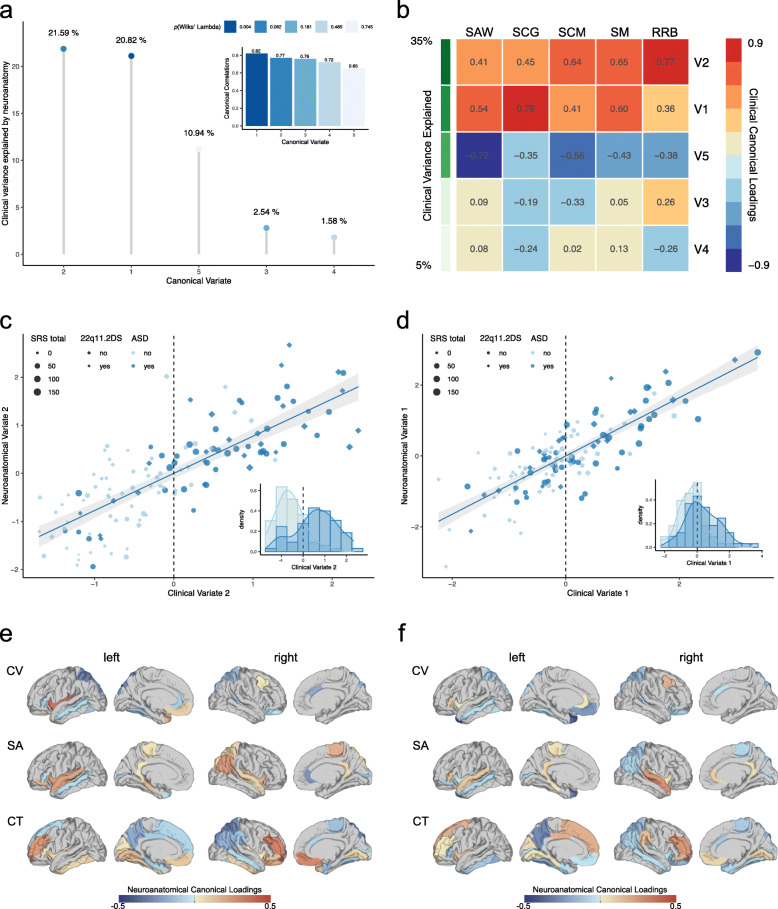
Fig. 2.
Results of the CCA across all individuals within our sample.a Canonical correlations (subplot) and canonical variates sorted in descending order based on their canonical correlations, and based on the percentage of clinical variance explained; b clinical canonical loadings depicting correlations between each of the five clinical canonical variates (V1-V5) and the five SRS subdomain scores in social awareness (SAW), social cognition (SCG), social communication (SCM), social motivation (SM), and restricted and repetitive behaviors (RRB). Canonical variates are sorted in descending order based on the percentage of explained clinical variance, as indicated in shades of green; c and d scatter plots depicting individual observations based on their scores on the second (c) and first (d) canonical variate, which explained the largest percentage of clinical variance. Data points are colored (ASD: yes vs. no) and shaped (22q11.2DS: yes vs. no) by group membership and sized by the individual’s total SRS score; e and f display canonical loadings of each neuroanatomical feature (i.e., cortical volume (CV), surface area (SA), and cortical thickness (CT)) on the second (e) and first (f) canonical variate

