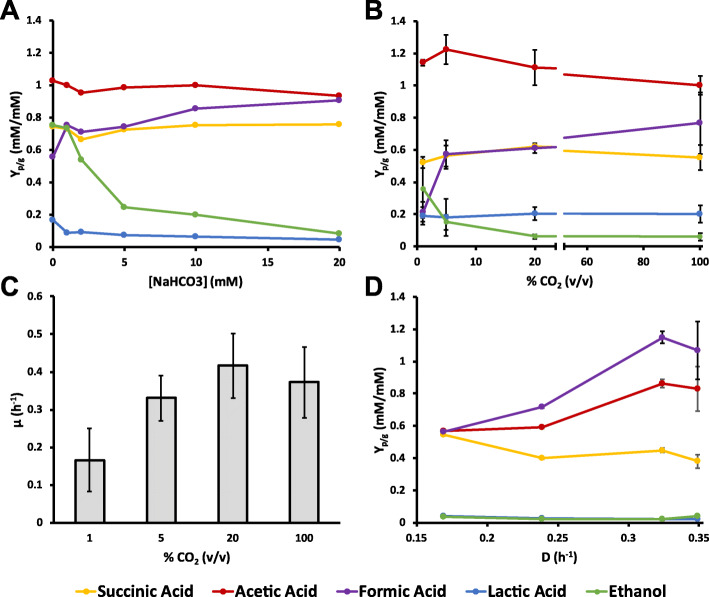
Fig. 2.
Testing the effect of available CO2. (a) Yield of moles fermentation product produced per consumed mole of glucose (starting concentration of 5 g/l) in serum bottle experiments containing different starting concentrations of NaHCO3. 1 ml of inoculum containing ~ 50 mM NaHCO3 was used for 50 ml medium, so the true NaHCO3 concentrations are ~ 1 mM higher. (b) Yield of moles fermentation product produced per consumed mole of glucose (starting concentration of 25 g/l) in 0.5 l batch fermentations with different concentrations of CO2 in N2 (v/v) sparged at 1 l/h. Every data point is the average of data from at least 3 independent fermentations, with the error bars representing the standard deviation. (c) Growth rates of the fermentations in B. (d) Yield of moles fermentation product produced per consumed mole of glucose (starting concentration of 5 g/l) in a continuous fermentation set a different (step-wise reduced) dilution rates. Every data point is the average of 3 measurements of the same steady state, taken at different time points, with the error bars representing the standard deviation

