Figure 3.

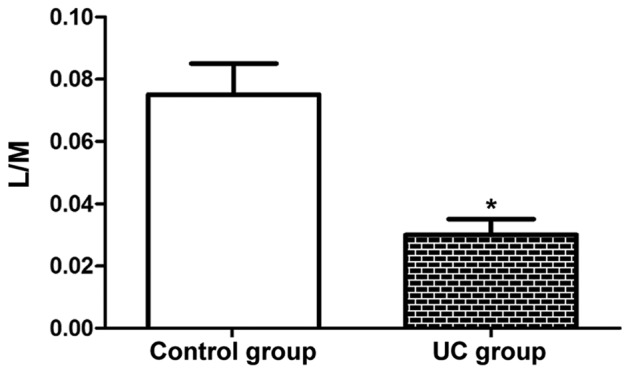
Intestinal mucosal permeability. The L/M ratio was notably lower in the UC group than that in the control group. *P<0.05 vs. control group. L, lactulose; M, mannitol; UC, ulcerative colitis.

Intestinal mucosal permeability. The L/M ratio was notably lower in the UC group than that in the control group. *P<0.05 vs. control group. L, lactulose; M, mannitol; UC, ulcerative colitis.