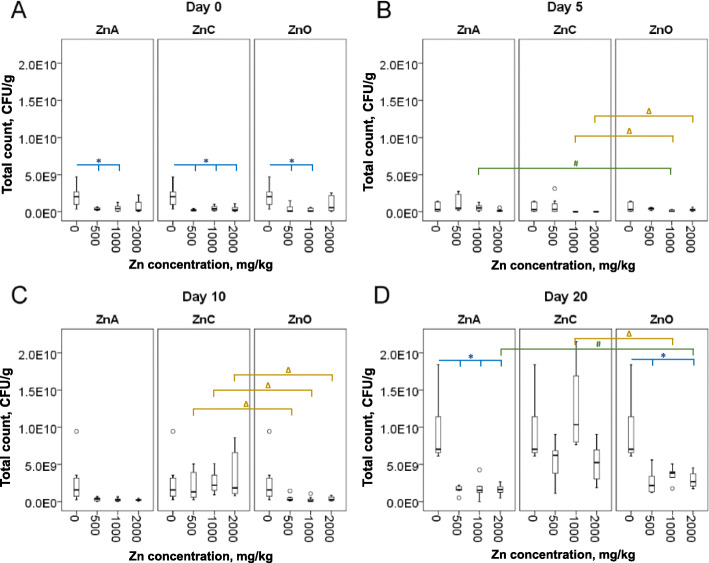
Fig. 1.
Total counts of aerobic bacteria at day 0 (a) and after 5 days (b), 10 days (c) and 20 days (d) of Zn treatment. Boxes represent Q1 and Q3 quartiles with median bar while T-whiskers represent 95% confidence intervals of 6–10 individuals. * indicates significant differences (P < 0.05) between group without treatment (0) and groups with Zn treatment. # indicates significant differences (P < 0.05) between ZnA and ZnO group (the equal Zn concentrations were compared). ∆ indicates significant differences (P < 0.05) between ZnC and ZnO group (the equal Zn concentrations were compared)

