
Figure 3.
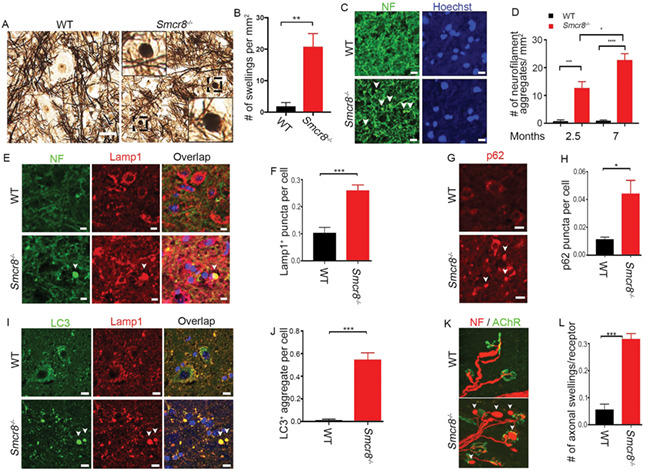
Impaired autophagy-lysosomal degradation leads to axonal swellings in Smcr8−/− mice. (A) Bielschowsky silver impregnation analyses revealed swelling neuronal processes in 7-month-old mutant spinal cords. Individual spheroid structures are enlargements of black boxed areas. Scale bars: 20 μm. (B) Quantification of numbers of swollen neuronal processes in spinal cord sections. (C) Representative imaging of spinal cords stained with antibodies against NF (NF, green). White arrowheads represent axonal swellings. Hoechst stains nuclei. Scale bars: 10 μm. (D) Quantification of NF-positive axonal swellings per mm2 in the spinal cords. Two-way ANOVA analysis with Bonferroni correction detected a significant difference between 2.5 and 7 months. (E, G, I) Confocal imaging of spinal cord sections stained with antibodies against NF (NF, green), LC3 (green), Lamp1 (red) and p62 (red). White arrowheads indicate axonal swellings, LC3-positive aggregates, or p62 puncta. Scale bars: 10 μm. (F, H, J) Quantification of Lamp1-positive puncta outside of perinuclear areas per cell (F), the number of p62 puncta per cell (H), and the number of LC3+ aggregate per cell (J). (K) Smcr8−/− mice display NMJ swellings stained with antibodies against NF (NF, red) and AChR (green). White arrowheads indicate swelling NMJs. (L) Quantification of numbers of NMJ swellings in Smcr8−/− mice. For all the experiments, error bars represent SEM using measurements averaged from ≥3 sections of each mutant mice (n = 3). Statistical analyses were performed with non-parametric Mann-Whitney test (*P < 0.05, **P < 0.01 and ***P < 0.001).