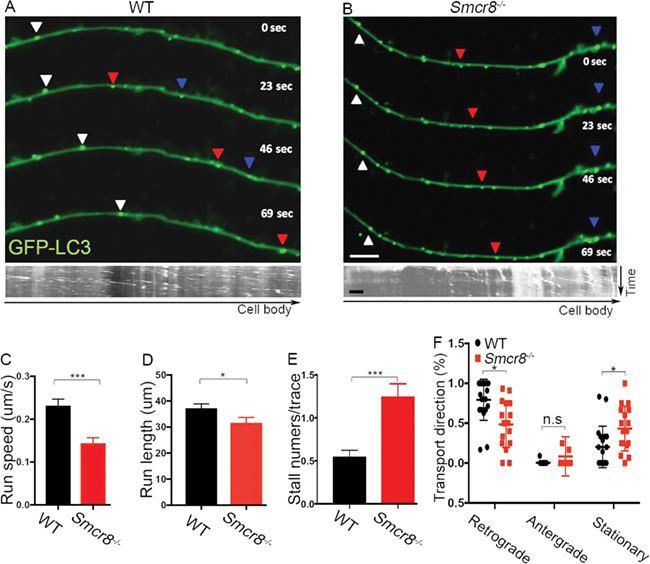
Figure 5.

Axonal transport is disrupted in Smcr8−/− MNs. (A, B) Representative time-lapse images and corresponding kymographs of GFP-LC3-labeled autophagosome transport in spinal MNs isolated from E13.5 spinal cords. Individual autophagosomes marked by white triangles show robust retrograde transport in WT and diminished motility in mutant MNs. Scale bars: 2 μm. (C) Quantification of net run speed in WT (n = 126) and Smcr8−/− (n = 120) MNs. (D) Quantification of total run length in WT (n = 145) and Smcr8−/− (n = 87) MNs. (E) Quantification of stall numbers per trace in WT (n = 109) and Smcr8−/− (n = 125) MNs. (F) Quantification of the percentages of retrograde, anterograde, and stationary transport in WT (n = 20) and Smcr8−/− (n = 18) MNs. Error bars represent SEM of ≥5 independent experiments with more than five mice per group (n > 5). Statistical analyses were performed with non-parametric Mann-Whitney test (*P < 0.05, ***P < 0.001, n.s. represents no significant difference detected).
