
Figure 1.
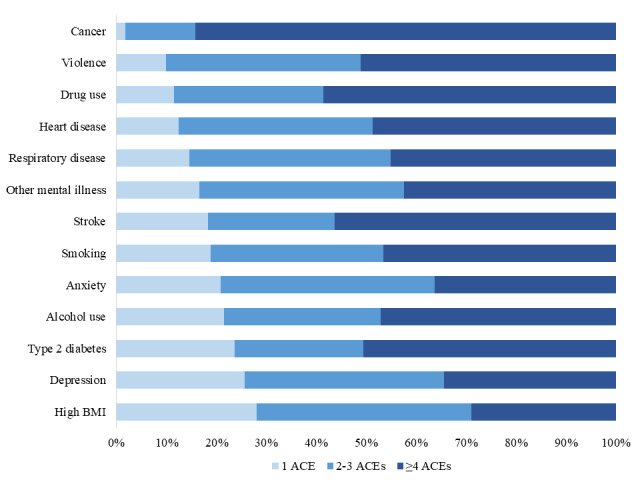
Proportion of ACE-attributable costs for each risk factor and cause of ill health attributed to 1, 2–3 and ≥4 ACE categories. ACE, adverse childhood experience; BMI, body mass index.
Official websites use .gov
A
.gov website belongs to an official
government organization in the United States.
Secure .gov websites use HTTPS
A lock (
) or https:// means you've safely
connected to the .gov website. Share sensitive
information only on official, secure websites.
Proportion of ACE-attributable costs for each risk factor and cause of ill health attributed to 1, 2–3 and ≥4 ACE categories. ACE, adverse childhood experience; BMI, body mass index.