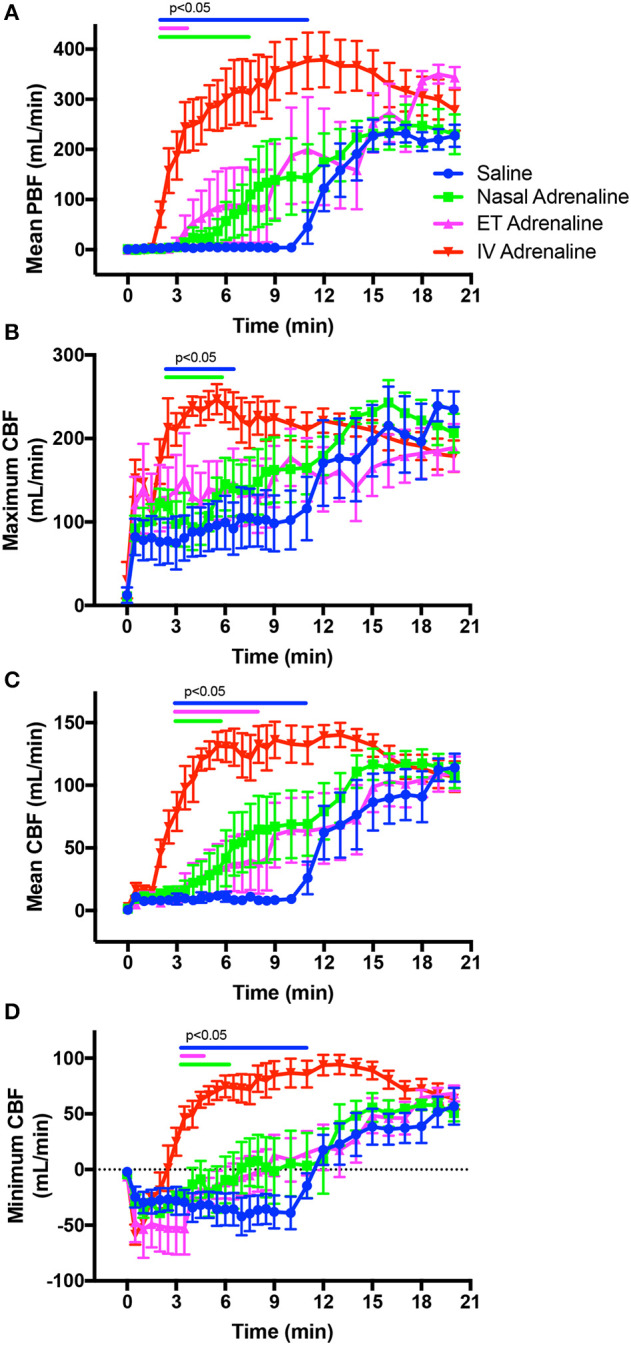
Figure 3.

Changes in mean pulmonary blood flow (PBF; A), maximum (systolic) carotid arterial blood flow (CBF; B), mean CBF (C), and minimum (diastolic) CBF (D) in intravenous (IV)-saline (blue), Nasal-adrenaline (green), Endotracheal-adrenaline (ET; magenta), and IV-adrenaline (red) lambs over the first 20 mins following the onset of chest compressions (at time zero). Data ranges indicated by the blue, green, and magenta bars designate values in IV-adrenaline lambs that are significantly (p < 0.05) greater than in IV-saline, Nasal-adrenaline, and ET-adrenaline lambs, respectively. Values in the IV-saline, Nasal-adrenaline, and ET-adrenaline lambs were not different from each other.
