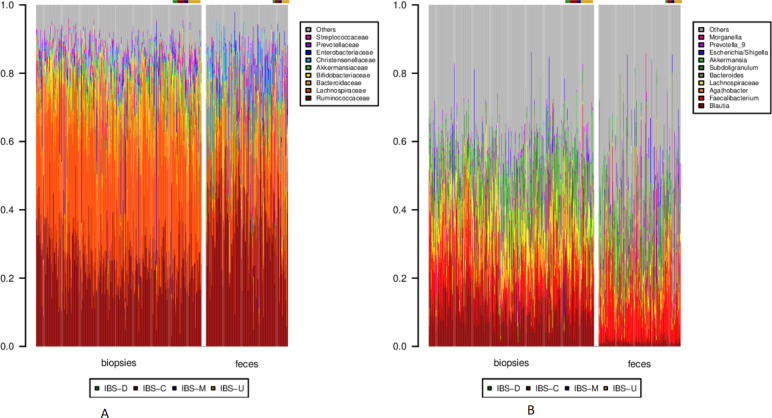
Figure 2.
Taxonomy barplots for each sample at the (A) family and (B) genus level. In each panel, biopsies are to the left, and faecal samples to the right. Within each sample type, healthy individuals are depicted first, followed by the IBS cases, as noted by the colour bar above each barplot. Only clades corresponding to on average >10% over all samples or >30% of a single sample are depicted. IBS, irritable bowel syndrome.

