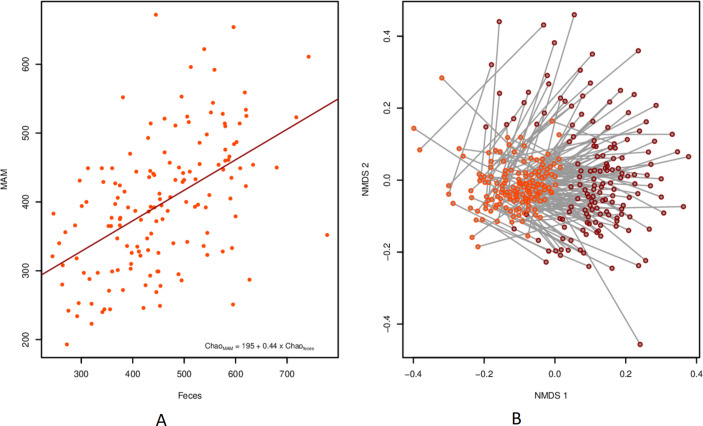
Figure 5.
Relationship between faeces and MAM from the same individual. (A) Scatterplot of Chao1 richness for each sample type per individual, including linear trend line. (B) NMDS with a line connecting each pair of samples. biopsies are highlighted in orange and faecal samples in red. MAM, mucosa-associated microbiome.

