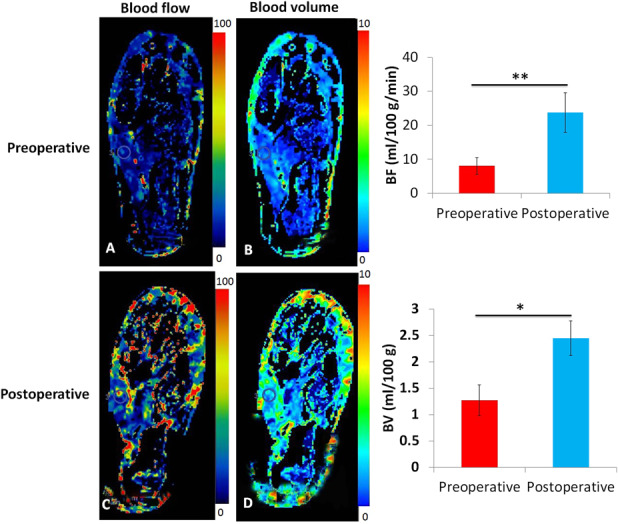
Fig. 8A-D.

These (A and B) preoperative and (C and D) postoperative perfusion maps show blood flow and volume in feet with diabetic foot ulcers treated with tibial cortex transverse distraction. Ulcerated feet tended to have increased blood flow and volume 3 months postoperatively compared with preoperatively. This observation was confirmed by the statistical analysis. The circles indicate the region of interests selected at the abductor hallucis muscle.
