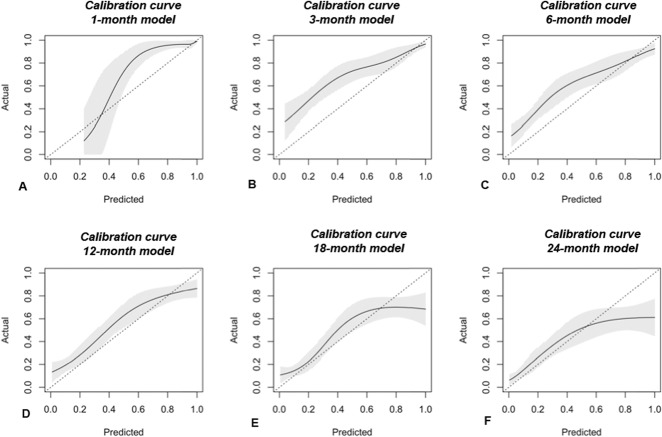
Fig. 1.
A-F The calibration curves of validation set data show the agreement between observed outcomes and those predicted by the (A) 1-month, (B) 3-month, (C) 6-month, (D) 12-month, (E) 18-month, and (F) 24-month PATHFx models. The shaded region depicts the 95% CI of the predictions. Perfect calibration to the training data overlies the 45° dotted line. Each model is reasonably well calibrated to the Memorial Sloan Kettering Cancer Center training data.

