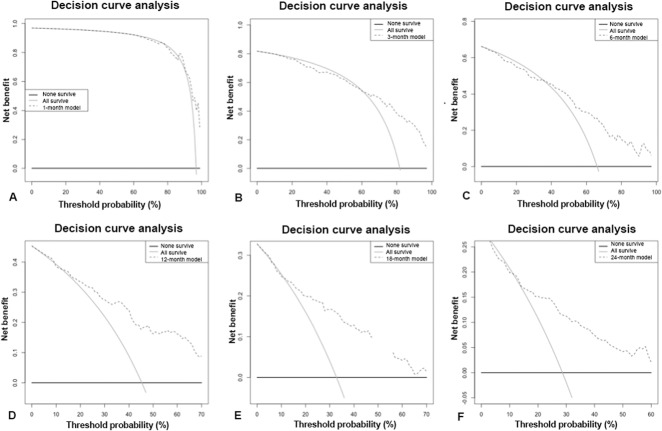
Fig. 3.
A-F The decision curve analysis (dashed line) of the predictive models based on RT data at (A) 1 month, (B) 3 months, (C) 6 months, (D) 12 months, (E) 18 months, and (F) 24 months indicates that all the models should be used rather than assuming all patients (continuous line) or none of the patients (thick continuous line) will survive longer than the period of each predictive model, except for the 1-month model where it is better to assume all survive than use the model; RT = radiotherapy-only group.

