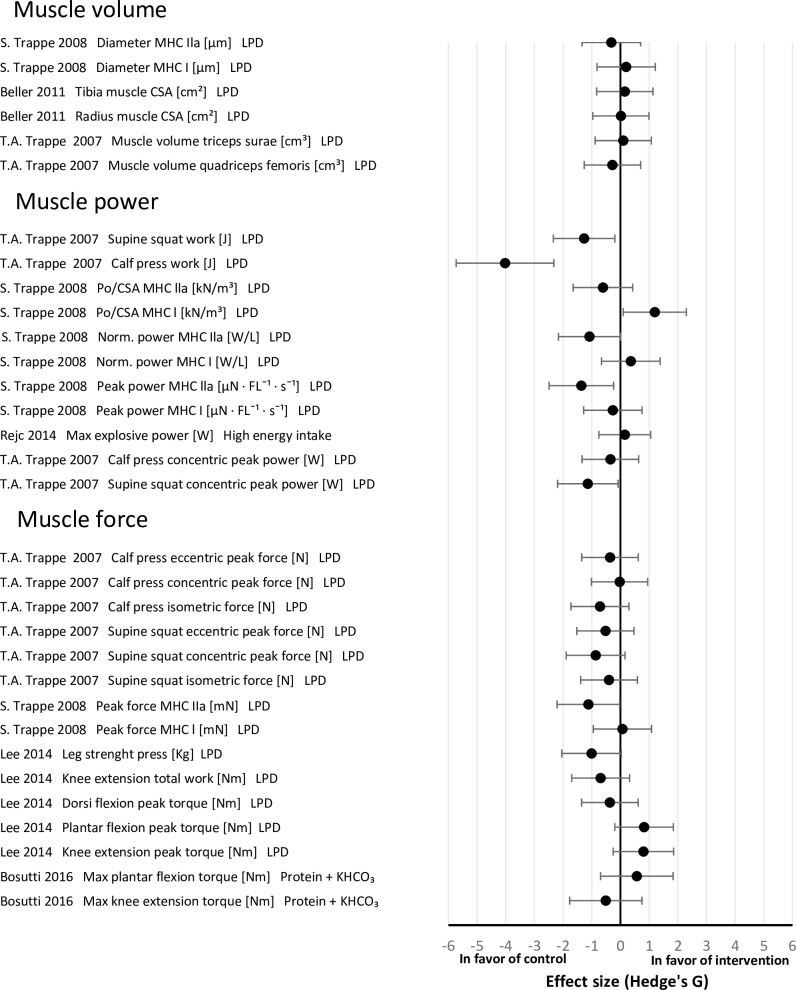
Fig 2. Effect size plot of operationally relevant muscle outcomes.
Effect size plot of operationally relevant muscle outcomes categorized into ‘muscle volume’, ‘muscle power’ and ‘muscle force’. Effect sizes were calculated by the mean differences between the control and intervention group of pre and post bed rest values with Hedges’ G and bias corrected for sample size with a confidence interval of 95%. All calculated effect sizes were defined as small (0.2), medium (0.5), large (0.8) or very large (1.3). The right direction on the x-axis indicates a positive effect of the intervention and the left direction on the x-axis indicates a negative effect of the intervention. CSA = cross sectional area; LPD = leucine protein diet; max = maximum; MHC = myosin heavy chain; Po = peak force.

