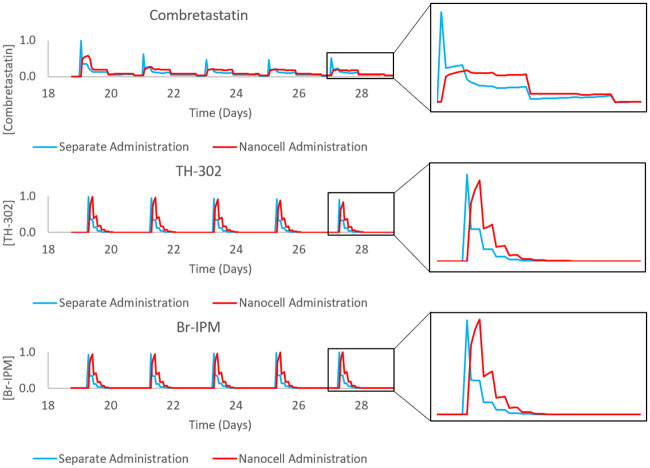
Fig 8. Normalized drug concentrations in the tumour area over the treatment schedule for combretastatin-first treatment administered either separately or through nanocells.
The left column of plots is the full treatment schedule used in simulations, the right column is a zoomed-in picture of the final drug administration to better observe the difference in release profiles. Notice the delayed release in the nanocell administration case.

