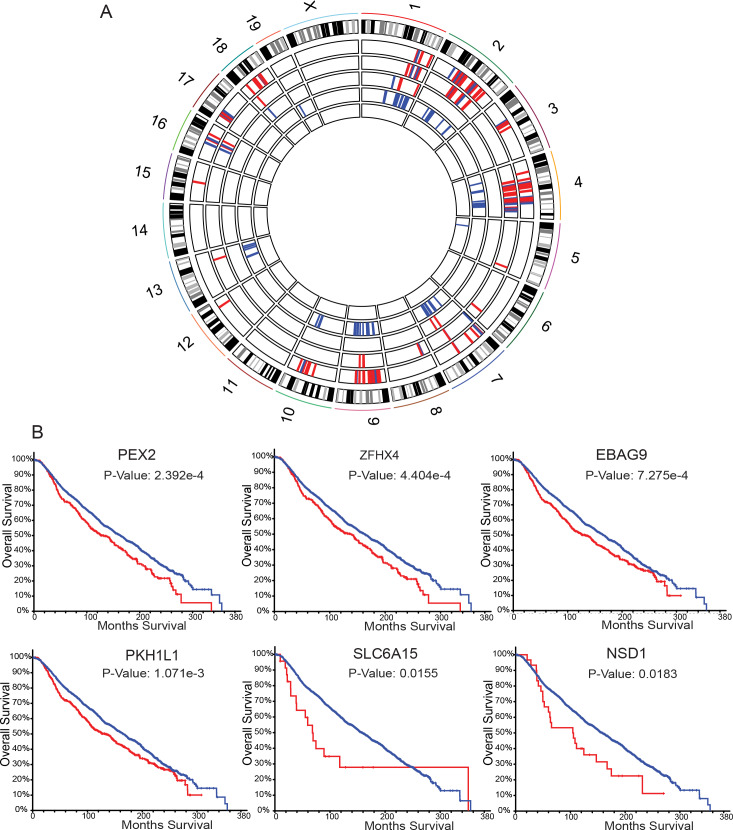
Fig 4. Metastasis-specific CNVs in the PyMT and Her2 mouse models.
A. Circos plot representing metastasis-specific genomic alterations. The outermost track shows the mouse chromosomes and established G-banding. The remaining five inner tracks show deleted (and amplified for MOLF/EiJ only) genomic regions in F1 PyMT mice resulting in enrichment of the non-FVB/NJ allele (red) or enrichment of FVB/NJ allele (blue). From the outermost track the strain order is as follows: MOLF/EiJ amplification, MOLF/EiJ deletion, CAST/EiJ deletion, C57BL/6J deletion, C57BL/10J deletion. B. Kaplan-Meier plots generated using METABRIC for six out of eight genes identified as metastasis drivers by exome-seq CNV analysis in mice that significantly stratify patient survival when altered in primary tumor tissue and reside on human chromosome 8 (blue = no CNV, red = CNV present).

