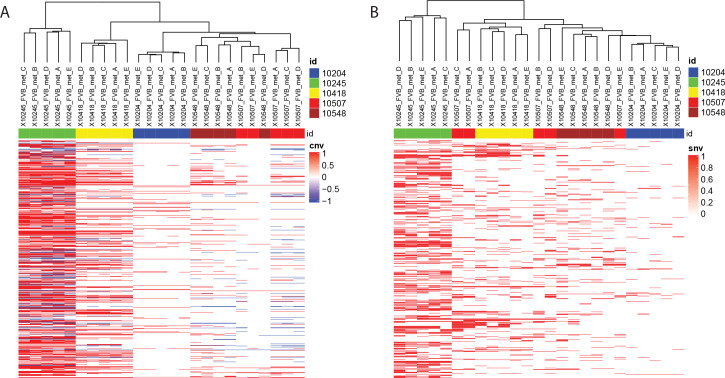
Fig 5. Metastases can originate from multiple primary tumour subclones.
Heat maps for hierarchical clustering of genomic a. CNV and b. SNV fingerprints from five metastases isolated from five mice and compared to matched primary tumors. Chromosomes are represented along the Y axis, and sample names across the X axis. Colored bands across the top of the heatmap indicate mouse ID (Blue: 10204, Green: 10245, Yellow: 10418, Red: 10507, burgundy: 10548). Within the heat maps, red indicates amplification (A), or presence of an SNV (B), and blue indicates a deletion (A).

