
Fig. 2.
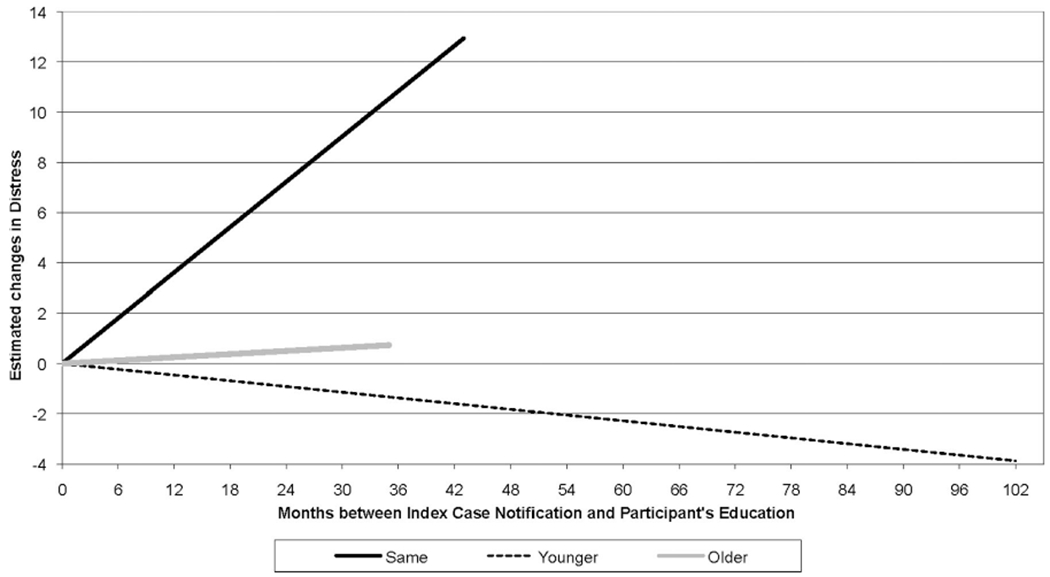
Estimated change in distress related to genetic testing. The y-axis represents the estimated change in Impact of Events Score (distress) based on the linear growth model. The x-axis represents the interval of time in months between the provision of genetic test results to the index case and the provision of genetic counseling to family members. Separate lines are provided for each generation. The zero point on the x-axis represents the index case, thus the line represents expected change in distress relative to the index case’s distress, controlling for covariates. Lines were truncated at the point at which data ended within each generation. Negative values presented within the younger generation reflect scores that are lower than the Index case rather than negative scores on the Impact of Events Scale.