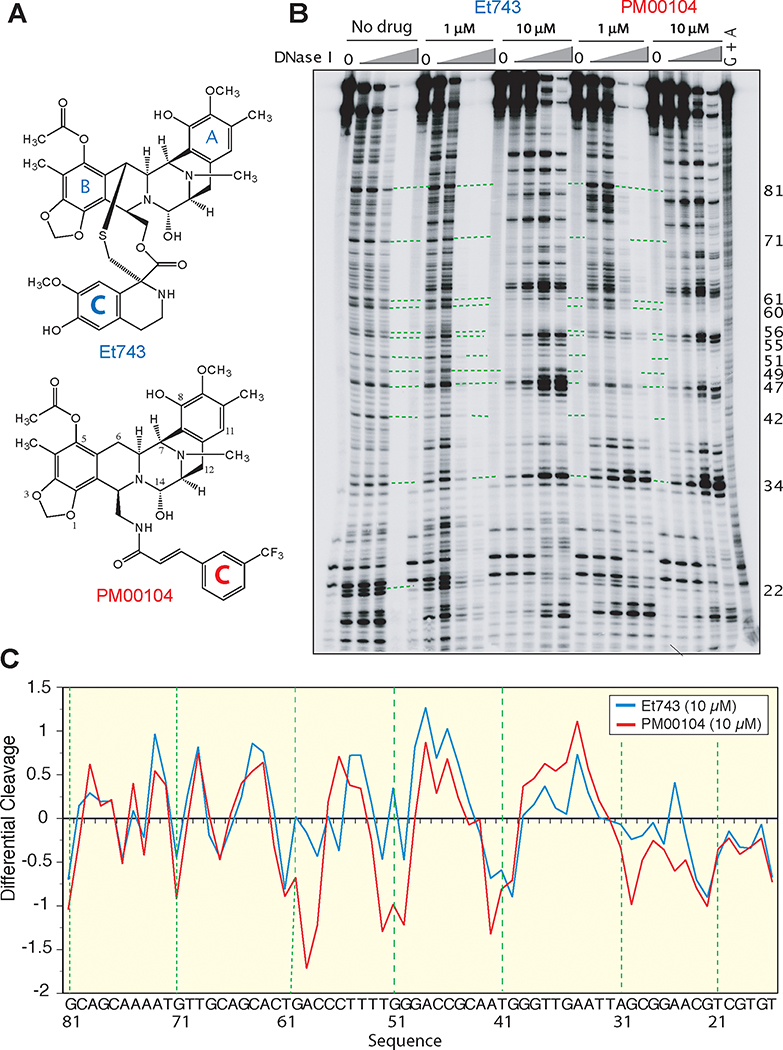
Figure 1. Comparative DNA binding profiles of PM00104 and Et743.
A, Chemical structures of Et743 and PM00104. B, Representative DNase I footprinting experiment. The DNA substrate [5’-end-labeled PvuII/HindIII fragment of pBluescript SK (–) phagemid DNA (pSK)] was reacted in the absence (No drug) or presence of 1 μM or 10 μM Et743 or PM00104 for 30 min at 37°C. Samples were then subjected to either no treatment (0) or treatment with increasing concentrations of deoxyribonuclease I (DNase I) for 1 min at 25°C. Reactions were stopped with 15 mM EDTA (final concentration). DNA fragments were separated in denaturing polyacrylamide gels. Lane G + A, purine ladder after formic acid treatment. Numbers on the right correspond to the DNA sequence indicated in panel C. C, Differential DNase I cutting in the presence of 10 μM PM00104 (red line) and Et743 (blue line). Negative and positive values correspond to drug-protected sites and enhanced cleavage, respectively. Vertical scales are in units of ln(fa)-ln(fc), where fa is the fractional cleavage at any bond in the presence of the drug and fc is the fractional cleavage of the same bond in the control, given closely similar extents of overall digestion. The results are displayed on a logarithmic scale and the DNA sequence is indicated at the bottom. Numbers on the right of panel B correspond to that sequence.

