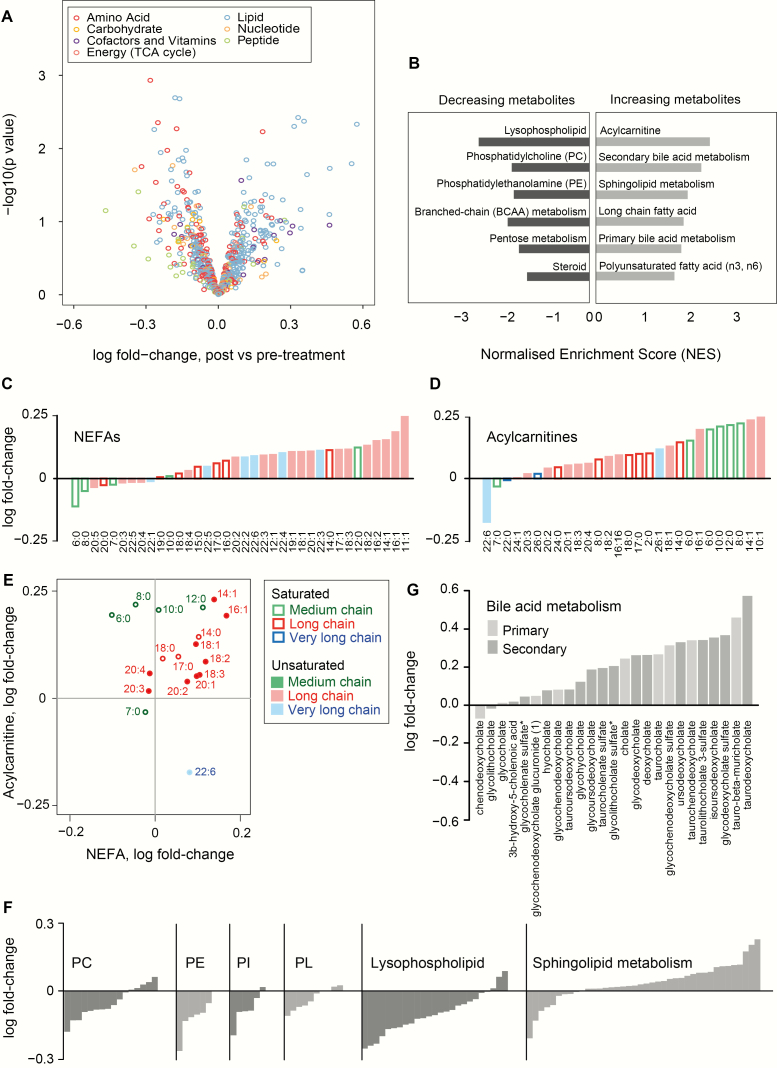
Figure 1.
Metabolome-wide changes after acute leptin treatment in congenital leptin deficiency. (A.) Volcano plot showing the acute change for each metabolite upon leptin treatment (“post”) compared to before treatment (“pre-treatment”) after correcting for confounding factors. Full results are in Table S1 (21). (B.) Metabolite-set enrichment analysis of sub-pathway annotations showing metabolite sets with FDR q value < 0.2 and raw P value < 0.05. Full results are in Table S2 (21). (C-E.) Global increase in NEFAs (C), acylcarnitines (D) and fold-change of corresponding NEFAs and acylcarnitines after leptin replacement. Filled symbols/bars indicate unsaturated, and unfilled symbols/bars represent saturated, fatty acids of different chain length: medium chain (C6-12), long chain (C13-21) and very long chain (C22 or more). (F.) Fold-change of metabolites after leptin treatment, illustrated for the following lipid classes: phosphatidylcholine (PC), phosphatidylethanolamine (PE), phosphatidylinositols (PI), plasmalogens (PL), lysophospholipids and sphingolipids. (G.) Fold-change of metabolites in the 2 sub-pathways “primary bile acid metabolism” (light grey bars) and “secondary bile acid metabolism” (dark grey bars). Metabolite-set enrichment analysis for these 2 sub-pathways is reported in Table S2, Fig. S2 (21).

