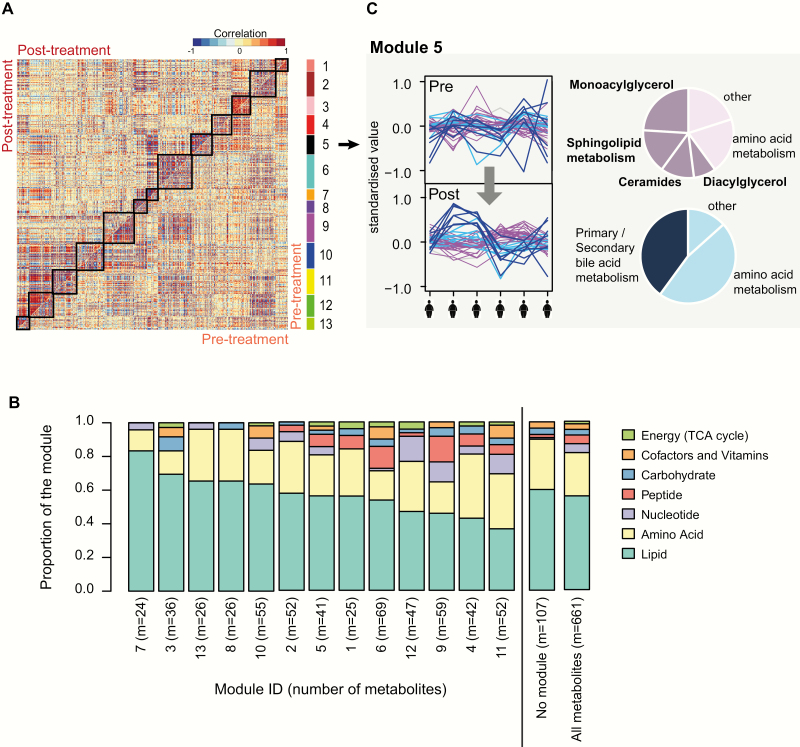
Figure 2.
Module analysis of changes in metabolites with acute leptin replacement. (A.) Metabolite correlation plot indicating the 13 modules with differential correlation in post-treatment samples compared with pre-treatment samples. The upper diagonal matrix shows correlation between pairs of metabolites in the post-treatment group while the lower diagonal matrix shows the correlation between pairs of metabolites in the pre-treatment group. Modules are identified in the heat map by squares and by a color bar on the right-hand side (labeled 1 to 13). Each module consists of 1 or more submodules comprised of metabolites which are correlated or anticorrelated across the 6 individuals. For each module, the constituent metabolites and their sub-pathway annotations are provided in Table S3 (21). (B.) Bar plots illustrate the super-pathway composition of modules 1-13, of the remaining metabolites which were not assigned to a module, and of all the metabolites. For a more detailed description of each module, the super-pathway and sub-pathway annotation of metabolites in each module is reported in Table S4 (21), and sub-pathway enrichments among the submodules are summarized in Table S5 (21). (C.) Illustrative example showing module 5. The line plots display the metabolites across the 6 individuals before (“pre”) and after (“post”) leptin treatment, showing a gain of correlation after treatment. Two submodules are negatively correlated with each other (depicted in pink and blue, respectively). Pie charts show the sub-pathway composition of each submodule (details in Table S5 (21)). The composition of a second module (module 7) is illustrated in Figure S5 (21).

