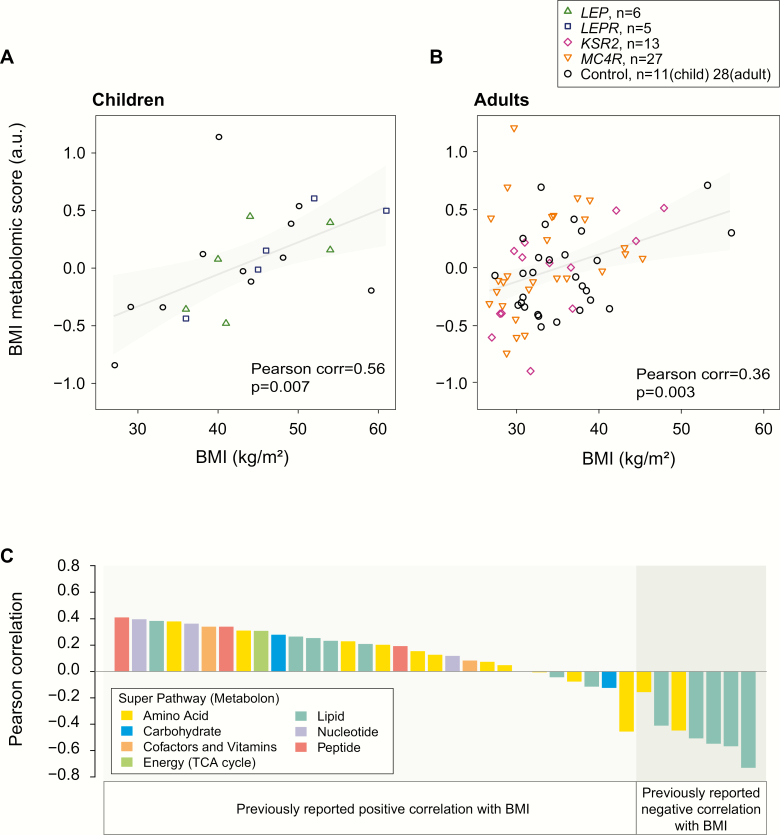
Figure 4.
Metabolomic signature of BMI is preserved in people with genetic obesity syndromes. (A-B.) Scatter plots show a summary score of BMI-associated metabolites (“BMI metabolomic score”) versus BMI for (A) obese children (2–18 years of age, n = 22) and (B) adults (18-55 years of age, n = 68) with genetic obesity syndromes (harboring mutations in LEP, LEPR, MC4R, KSR2) and age- and BMI-matched controls. The grey line and shaded regions illustrate fitted linear regression models (95% confidence) to highlight the significant positive association with BMI. Characteristics of the study participants are summarized in Table 2. C. For each metabolite comprising the metabolomic BMI score, the bar plot illustrates the Pearson correlation of BMI and the metabolite value across individuals. The correlation between metabolite score and BMI is compared to correlations reported in [30].

