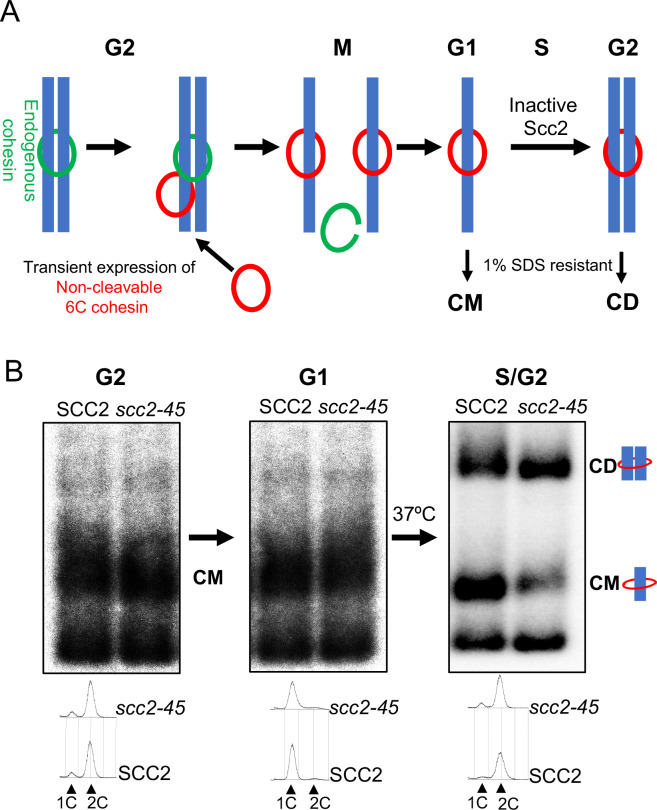
Figure 2. Chromosomal cohesin is converted into cohesive structures in the absence of Scc2 activity.
(A) A schematic depiction of the cohesin conversion assay, see the results and Materials and methods sections for detailed description of the assay. Green rings denote endogenous cohesin and red rings denote non-cleavable 6C cohesin. Only the latter molecules are capable of generating SDS-resistant catenated monomers (CMs) and catenated dimers (CDs). (B) Wild type (K24697) and scc2-45 (temperature sensitive mutant of Scc2) (K24738) strains that contain genes coding for 6C non cleavable cohesin (2C SMC1 2C SMC3 and GALp-2C SCC1NC) were arrested in G2 phase, the expression of 2C Scc1NC was induced by addition of galactose for 45 min. Mini-chromosome IP of the cultures at this stage shows CMs formed in both strains. The cultures were released from the G2 arrest and arrested in the subsequent the G1 phase, mini-chromosome IP of the cultures at this stage shows CMs formed in the previous G2 phase being retained in the subsequent G1 in both strains. The cultures were released from the G1 arrest and allowed to undergo replication at 37°C (in order to inactivate Scc2 in the scc2-45 strain), mini-chromosome IP shows formation of CDs in both the wild type and scc2-45 strains, in the scc2-45 mutant strain this is accompanied by a reduction in the amount of CMs. The FACS profiles of the two cultures at different stages of the experiment is shown below the respective southern blots. The data shown is representative of three independent biological repeats.


