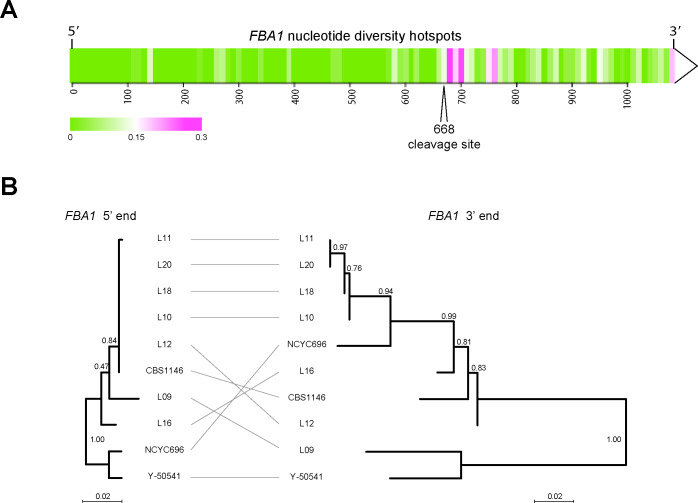
Figure 3. Different evolutionary dynamics of the 5’ and 3’ parts of T. delbrueckii FBA1.
(A) Heatmap showing regions of nucleotide sequence diversity (π) among 15 sequenced FBA1 alleles from T. delbrueckii isolates, plotted in 10 bp windows. (B) Inconsistency of phylogenetic trees obtained from the 5’ and 3’ ends of FBA1 alleles from different T. delbrueckii strains (5’ end: bases 1–667; 3’ end: bases 669–1083). The alleles from strains CBS1146 and L09 are also called TdFBA1-S and TdFBA1-R, respectively. The trees are drawn to the same scale and were generated from nucleotide sequences using PhyML as implemented in Seaview v4.5.0 (Gouy et al., 2010) with default parameters. Bootstrap support from 1000 replicates is shown.

