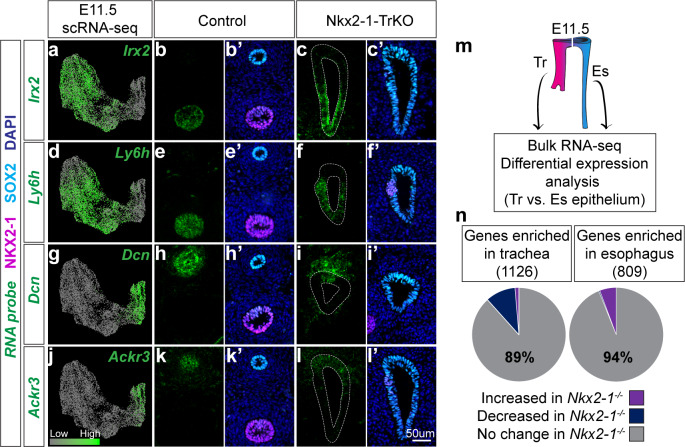
Figure 3. Identification of an NKX2-1-independent tracheal and esophageal program.
(a-l) RNA localization of NKX2-1-independent tracheal (Irx2, Ly6h) and esophageal (Dcn, Ackr3) makers identified by scRNA-seq and Nkx2-1-/- mutant RNA-seq data at E11.5. First column shows projection of RNA expression level as determined by scRNA-seq on UMAP. Second-fifth columns show RNA localization (green) in E11.5 control and Nkx2-1-TrKO embryos with immunofluorescent staining of NKX2-1 (magenta) and SOX2 (cyan). 8/8 Nkx2-1-TrKO embryos had TEF phenotype, n = 3 embryos/staining combination. All images were captured at 20X magnification and displayed at the same scale. Scale bar = 50 um. (m) Schematic of experimental procedures for RNA-seq and differential expression analysis of WT trachea and esophagus for comparison with Nkx2-1-/- mutant RNA-seq data. n = 3 biological replicates with four pooled embryos/replicate. See also: Figure 3—source data 1. (n). NKX2-1-dependent genes as a portion of genes enriched in WT trachea (left) and esophagus (right). NKX2-1-independent genes make up 89% of tracheal-enriched genes and 94% of esophageal enriched genes.


