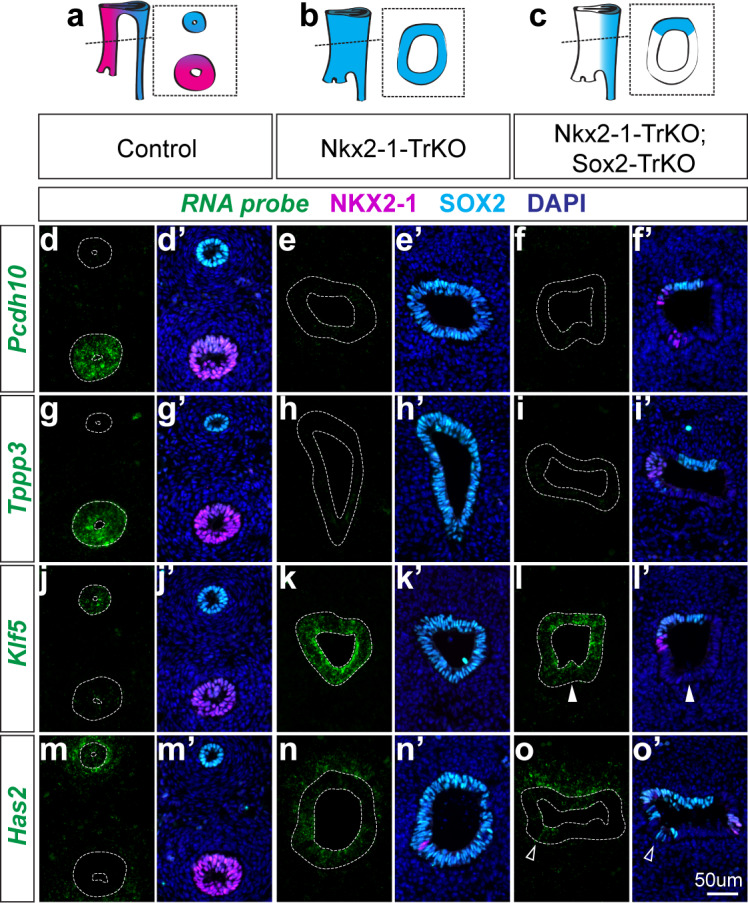
Figure 5. NKX2-1 regulates target genes in a SOX2-dependent and independent manner.

(a-c) Schematic of Nkx2-1; Sox2 compound mutant analysis phenotypes and resulting NKX2-1 and SOX2 expression patterns in E11.5 control embryos (a), Nkx2-1-TrKO mutants (b), Nkx2-1-TrKO; Sox2-TrKO mutants (c). 8/8 Nkx2-1-TrKO embryos and 6/6 Nkx2-1-TrKO; Sox2-TrKO embryos examined had TEF phenotype. (d-f) RNA localization of NKX2-1-dependent, SOX2-independent gene Pcdh10 in control (d), Nkx2-1-TrKO (e), and Nkx2-1-TrKO; Sox2-TrKO (f) embryos with immunofluorescent staining of NKX2-1 (magenta) and SOX2 (cyan). (g–i) Tracheal, NKX2-1-dependent, SOX2-independent gene Tppp3. (j–l) Esophageal, NKX2-1-dependent, SOX2-independent gene Klf5. Solid arrowheads indicate SOX2-negative, Klf5-positive ventral cell. (m–o) Esophageal, NKX2-1-dependent, SOX2-dependent gene Has2. Arrowheads indicate ventral SOX2-positive, Has2-positive cells. n = 3 embryos/staining combination. All images were captured at 20X magnification and displayed at the same scale. Scale = 50 um.
